. 2015 Feb 15:749:12-9.
doi: 10.1016/j.ejphar.2014.12.020. Epub 2014 Dec 31.

Aspirin may influence cellular energy status

Affiliations

Aspirin may influence cellular energy status

Pratibha Kamble et al. Eur J Pharmacol. .

Abstract

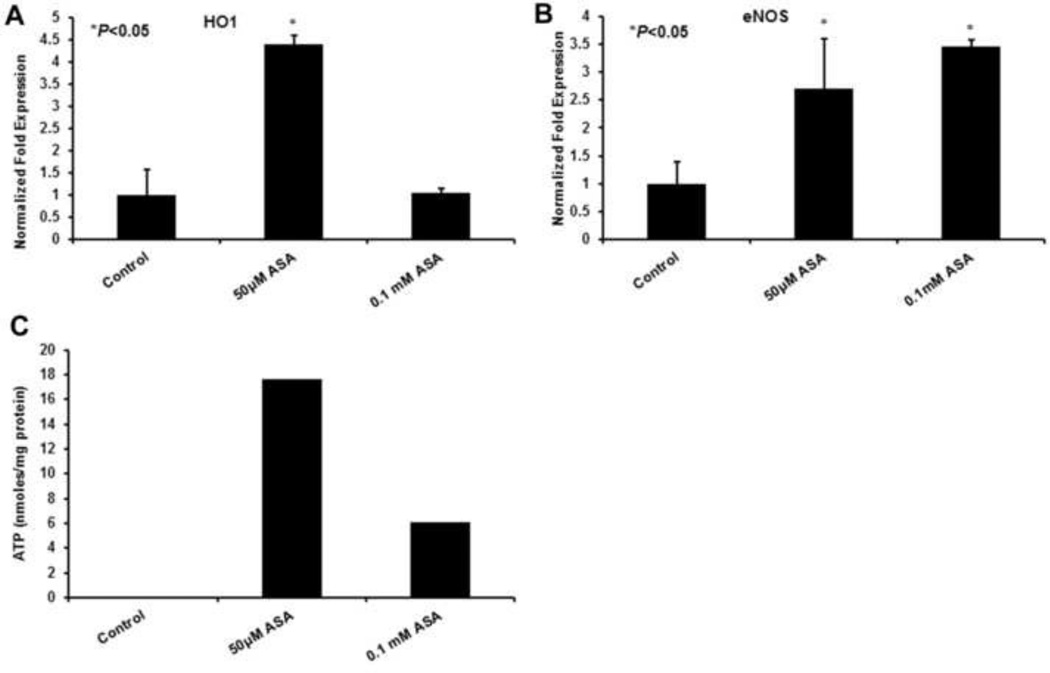
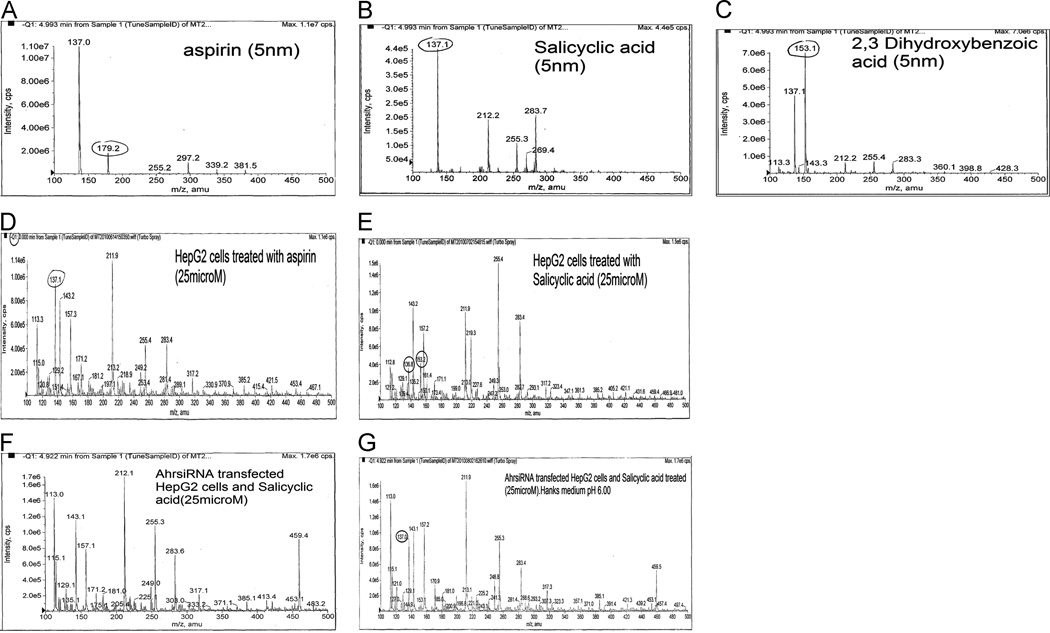
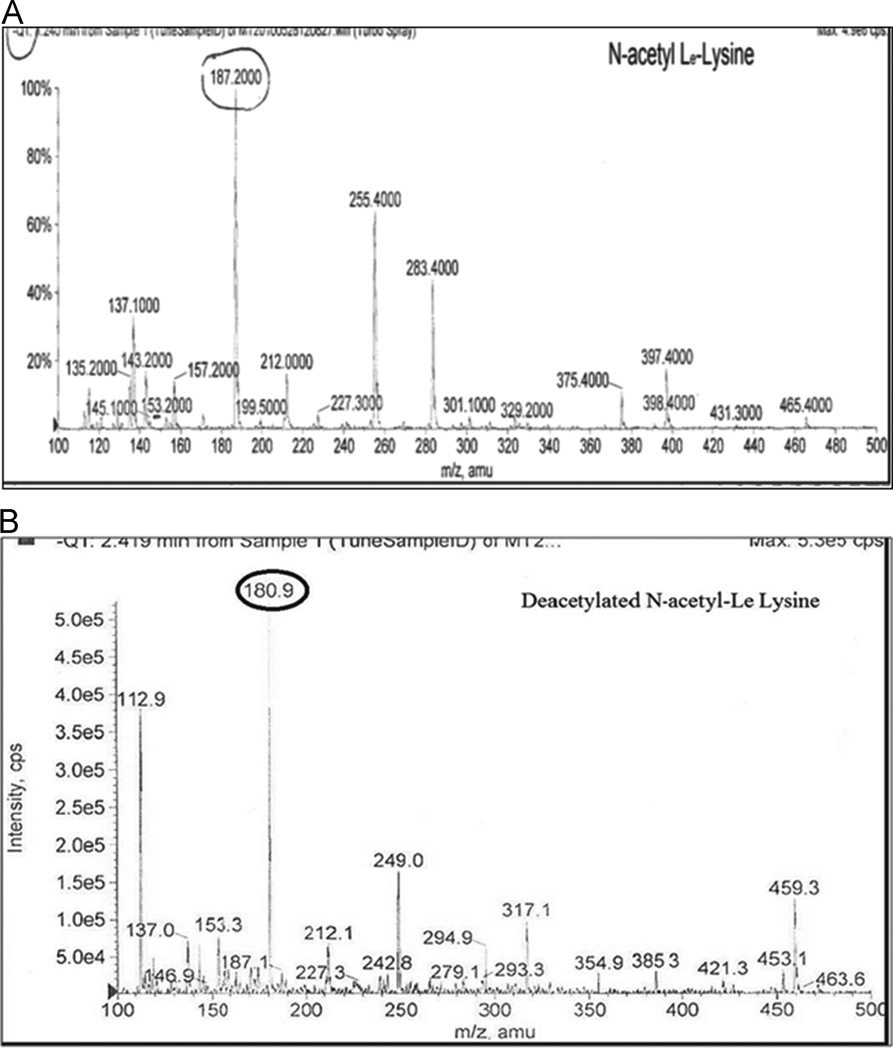
In our previous findings, we have demonstrated that aspirin/acetyl salicylic acid (ASA) might induce sirtuins via aryl hydrocarbon receptor (Ah receptor). Induction effects included an increase in cellular paraoxonase 1 (PON1) activity and apolipoprotein A1 (ApoA1) gene expression. As predicted, ASA and salicylic acid (SA) treatment resulted in generation of H2O2, which is known to be an inducer of mitochondrial gene Sirt4 and other downstream target genes of Sirt1. Our current mass spectroscopic studies further confirm the metabolism of the drugs ASA and SA. Our studies show that HepG2 cells readily converted ASA to SA, which was then metabolized to 2,3-DHBA. HepG2 cells transfected with aryl hydrocarbon receptor siRNA upon treatment with SA showed the absence of a DHBA peak as measured by LC-MS/MS. MS studies for Sirt1 action also showed a peak at 180.9 m/z for the deacetylated and chlorinated product formed from N-acetyl lε-lysine. Thus an increase in Sirt4, Nrf2, Tfam, UCP1, eNOS, HO1 and STAT3 genes could profoundly affect mitochondrial function, cholesterol homeostasis, and fatty acid oxidation, suggesting that ASA could be beneficial beyond simply its ability to inhibit cyclooxygenase.

Keywords: ASA; Fatty acid oxidation; H(2)O(2); Mitochondrial transcription factor A.


Figures

Fig 1
Fig 1. Genes involved in regulation of mitochondrial function
HepG2 cells cultured in 6 well plates were treated with ASA (50 μM-0.1 mM ASA) for 48 h. As shown here, at 50 μM concentration Sirt4 (Fig 1A), Nrf2 (Fig 1B), Tfam (Fig 1C), UCP1 (Fig 1D) and STAT3 (Fig 1E) genes were increased compared to control. Values are expressed as mean ± S.D. (n=3). Statistically significant changes between untreated and treated sets are marked as *(P<0.05).
Fig 2
Fig 2. Genes involved in lipogenesis and cholesterol homeostasis
HepG2 cells treated with ASA (50 μM) showed a significant increase in gene expression of liver × receptorα (LXR) (Fig 2A), farnesoid × receptor (FXR) (Fig 2B) and PPARα (Fig 2C) as compared to control. The fold induction values are reported as mean ± S.D. (n=3) and statistical significance is shown as *(P<0.05).
Fig 3
Fig 3. ASA role in induction of HO1, eNOS and ATP levels in HepG2 cells
A significant increase was observed in HO1 (Fig 3A) and eNOS (Fig 3B) gene expressions at 50 μM ASA treated HepG2 cells as compared to controls. As shown in C, dose-dependent increase in ATP levels were observed in ASA-treated cells. Values are represented as mean ± S.D. (n=3) with statistical significance shown as *(P<0.05).
Fig 4
Fig 4. LC-MS/MS studies for detection of ASA metabolites in both HepG2 cells and transfected HepG2 cells treated with ASA and SA
Figures 4A, B and C represent standard peaks for ASA, SA and DHBA, respectively. Figure 4 D and E show m/z values for ASA, SA and DHBA used to detect the values obtained after HepG2 cell treatment with ASA and SA. A complete absence of a peak is noticeable for DHBA shown in HepG2 cells transfected with Ah receptor siRNA (Fig 4F); however, the medium alone extracted with ether after compound separation did show m/z value for SA (Fig 4G).
Fig 5
Fig 5. LC-MS/MS studies for detection of Sirt1 in ASA-treated HepG2 cells for deacetylation of N-acetyl-Lε-Lysine
Standard form, NAC (A) shows a peak at 189 amu. HepG2 cells treated with ASA (50μM) alone have shown Sirt1 increase and also its deacetylation of substrate. Treatment of HepG2 cells with N-acetyl-Lε-Lysine show m/z value at 180.9 amu (Fig 5B).

References

    1. Alcendor RR, Kirshenbaum LA, Shin-ichiro I, Vatner SF, Sadoshima J. Silent information regulator 2α, a longevity factor and class III histone deacetylase, is an essential endogenous apoptosis inhibitor in cardiac myocytes. Circ. Res. 2004;95:971–980. - PubMed
    1. Canto C, Gerhart-Hines Z, Feige JN, Lagouge M, Noriega L, Milne JC, Elliott PJ, Puigserver P, Auwerx J. AMPK regulates energy expenditure by modulating NAD+ metabolism and SIRT1 activity. Nature. 2009;458:1056–1060. - PMC - PubMed
    1. Claria J, Serhan CN. Aspirin triggers previously unrecognized bioactive eicosanoids by human endothelial cell-leukocyte interactions. Proc. Natl. Acad Sci. 1995;92:9475–9479. - PMC - PubMed
    1. Clark E, Foresti RC, Green J, Motterlini R. Dynamics of haem oxygenase-1 expression and bilirubin production in cellular protection against oxidative stress. Biochem. J. 2000;348:615–619. - PMC - PubMed
    1. Cuadrado A, Rojo AI. Heme oxygenase-1 as a therapeutic target in neurodegenerative diseases and brain infections. Curr. Pharm. Des. 2008;14(5):429–442. - PubMed

Publication types

MeSH terms

Substances