

Excluded-volume effects in living cells
- PMID: 25557778
- PMCID: PMC4506553
- DOI: 10.1002/anie.201409847
Excluded-volume effects in living cells
Abstract
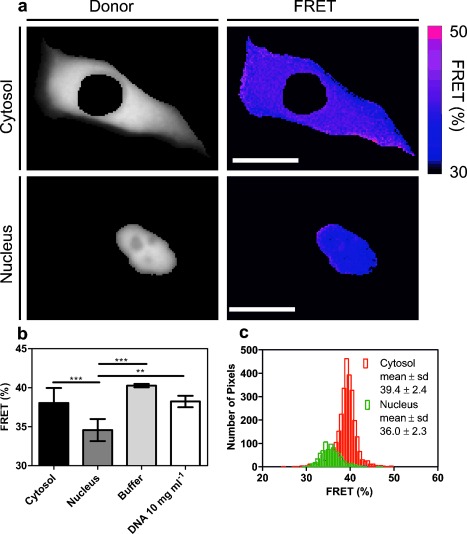
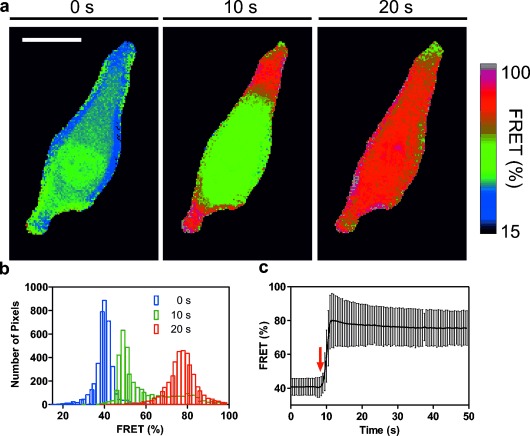
Biomolecules evolve and function in densely crowded and highly heterogeneous cellular environments. Such conditions are often mimicked in the test tube by the addition of artificial macromolecular crowding agents. Still, it is unclear if such cosolutes indeed reflect the physicochemical properties of the cellular environment as the in-cell crowding effect has not yet been quantified. We have developed a macromolecular crowding sensor based on a FRET-labeled polymer to probe the macromolecular crowding effect inside single living cells. Surprisingly, we find that excluded-volume effects, although observed in the presence of artificial crowding agents, do not lead to a compression of the sensor in the cell. The average conformation of the sensor is similar to that in aqueous buffer solution and cell lysate. However, the in-cell crowding effect is distributed heterogeneously and changes significantly upon cell stress. We present a tool to systematically study the in-cell crowding effect as a modulator of biomolecular reactions.
Keywords: FRET; biophysics; biosensors; excluded-volume effect; macromolecular crowding.
© 2014 The Authors. Published by Wiley-VCH Verlag GmbH & Co. KGaA. This is an open access article under the terms of the Creative Commons Attribution Non-Commercial NoDerivs License, which permits use and distribution in any medium, provided the original work is properly cited, the use is non-commercial and no modifications or adaptations are made.
Figures

References
Publication types
MeSH terms
Substances
LinkOut - more resources
Full Text Sources
Other Literature Sources
