. 2015 Jan 8;96(1):54-69.
doi: 10.1016/j.ajhg.2014.11.012. Epub 2014 Dec 31.

Uncovering the genetic history of the present-day Greenlandic population

Affiliations

Uncovering the genetic history of the present-day Greenlandic population

Ida Moltke et al. Am J Hum Genet. .

Abstract

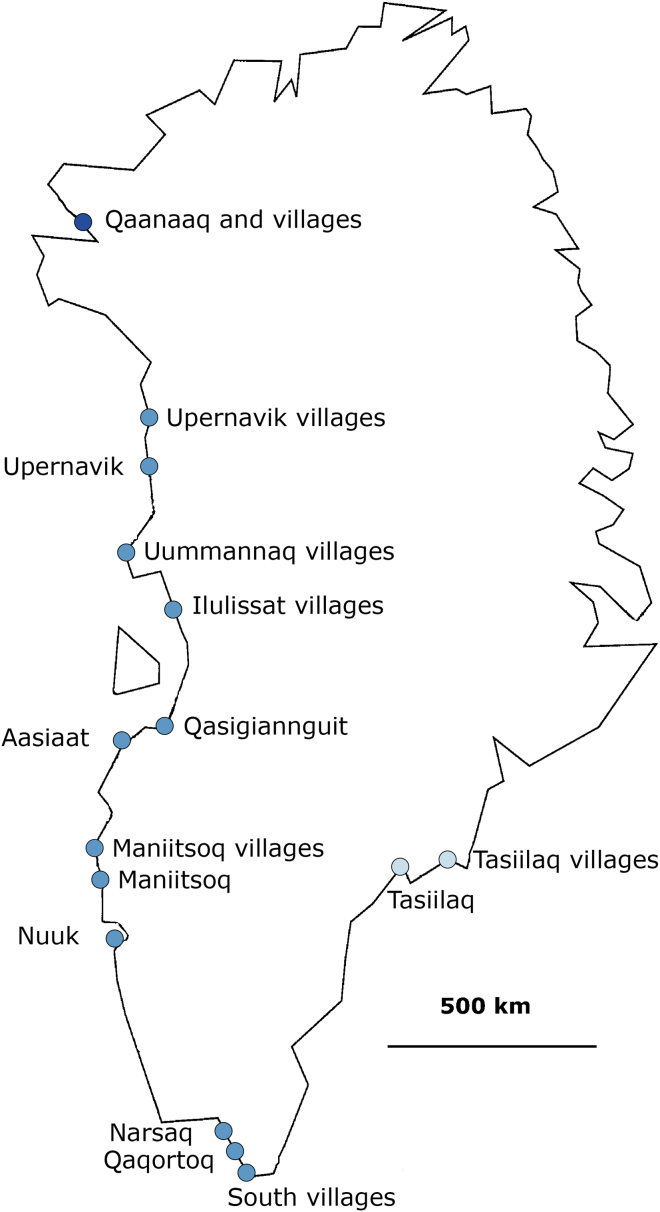
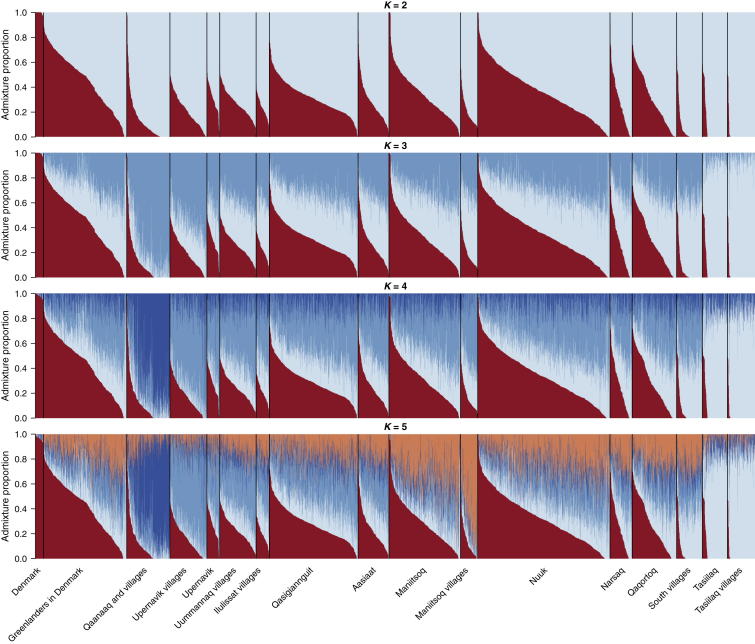
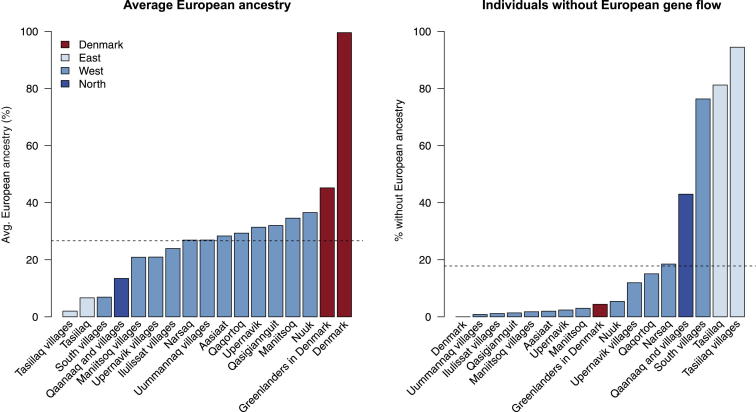
Because of past limitations in samples and genotyping technologies, important questions about the history of the present-day Greenlandic population remain unanswered. In an effort to answer these questions and in general investigate the genetic history of the Greenlandic population, we analyzed ∼200,000 SNPs from more than 10% of the adult Greenlandic population (n = 4,674). We found that recent gene flow from Europe has had a substantial impact on the population: more than 80% of the Greenlanders have some European ancestry (on average ∼25% of their genome). However, we also found that the amount of recent European gene flow varies across Greenland and is far smaller in the more historically isolated areas in the north and east and in the small villages in the south. Furthermore, we found that there is substantial population structure in the Inuit genetic component of the Greenlanders and that individuals from the east, west, and north can be distinguished from each other. Moreover, the genetic differences in the Inuit ancestry are consistent with a single colonization wave of the island from north to west to south to east. Although it has been speculated that there has been historical admixture between the Norse Vikings who lived in Greenland for a limited period ∼600-1,000 years ago and the Inuit, we found no evidence supporting this hypothesis. Similarly, we found no evidence supporting a previously hypothesized admixture event between the Inuit in East Greenland and the Dorset people, who lived in Greenland before the Inuit.


Figures

Figure 1
Figure 1
Sampling Locations in Greenland In this map of Greenland, dots illustrate the towns and villages where the Greenlandic participants are from. Note that for some of the locations, the dot represents several small villages up to 100 km apart. The color scheme reflects the geographical division of Greenland into north (dark blue), west (including south, medium blue), and east (light blue).
Figure 2
Figure 2
Estimated Admixture Proportions for Individuals from Different Locations in Greenland Admixture proportions for all Greenlandic and Danish individuals in this study (the full data set) were estimated with ADMIXTURE under the assumption of different numbers of ancestral populations (K = 2–5). When another component was added (K = 6), the additional component did not correlate with location (data not shown). For each K, the results are ordered according to where the individuals are from. The color scheme for K = 4 is the same as in Figure 1.
Figure 3
Figure 3
Extent of European Ancestry at Different Locations in Greenland The results shown are summaries of the admixture proportions estimated for all individuals included in this study (the full data set) under the assumption of two ancestral populations (K = 2). The bars in the left plot show the average European ancestry proportion at each sampling location, and the dashed line shows the average for the entire data set. The bars in the right plot show the fraction of individuals without European admixture for each sampling location, and the dashed line shows the fraction for the entire data set. The color scheme is the same as in Figure 1.
Figure 4
Figure 4
PCA of the Full Data Set The first two principal components (PC1 and PC2) based on a PCA of the genetic covariance matrix of all the Greenlandic and Danish individuals included in the study. The estimated percentages of the variation explained by the two principal components are shown in the axis labels. The color scheme is the same as in Figure 1.
Figure 5
Figure 5
SFSs for Greenlanders and Four HapMap Populations The SFSs for 18 Greenlanders (36 chromosomes) without European ancestry, here denoted GR, are compared with the SFSs for 18 individuals from each of the four original HapMap populations: CEU (European ancestry), JPT (Japanese ancestry), CHB (Han Chinese ancestry), and YRI (African ancestry). All SFSs were estimated from sequencing data. The Greenlanders were exome sequenced, and the HapMap populations were whole-genome sequenced as part of the 1000 Genomes Project. Only the 75 Mb extended target regions defined by Agilent SureSelect were used for all five populations. The estimated variability (fraction of polymorphic sites) in each of the populations is shown in parentheses in the legend.
Figure 6
Figure 6
LD Decay for Different Populations The average LD (r2) is shown as a function of the physical distance on autosomes. LD was estimated in Danes, Greenlanders without European admixture, and all Greenlanders (the full data set was used, and admixture was ignored). Additionally, LD in all Greenlanders (the full data set) was estimated with a method that takes admixture into account. This was done under the assumption of two ancestral populations, and the estimates correspond to estimates for the ancestral European population (EU component) and the ancestral Inuit population (Inuit component). Note that only 50 Danes were used for the estimate of LD for Danes, which is why the mean r2 is higher at greater distances for the Danes than for the European component of the Greenlandic population. For each subset of the data, a minor allele cutoff of 5% was used.
Figure 7
Figure 7
Maximum-Likelihood Tree Relating Individuals from All the Different Sampling Locations The tree was estimated by TreeMix from allele frequencies that were estimated from the full data set without LD and corrected for European admixture. The color scheme is the same as in Figure 1, except that the lightest blue color has been replaced by gray so that it is easier to read.
Figure 8
Figure 8
D Statistics for Different Possible Topologies CHB are the Han Chinese HapMap individuals, D is the statistic, and Z is a standard score (Z score), which is usually considered significant with an absolute value above 3. The first two topologies were rejected, whereas the last was not. Using Upernavik villages instead of South villages also gave a nonsignificant result (Z = −0.14). Thus, we cannot reject that Qaaqaaq is an outgroup, consistent with the single-wave coastal route. Suggested gene flows that could explain the rejection of the topology are shown as red arrows. The results shown are based on the restricted Greenlandic data set combined with HapMap samples (this data set includes Greenlandic individuals who are not closely related, do not have any recent European ancestry, and have not recently migrated within Greenland).

References

    1. Gulløv H.C. Gyldendal; Copenhagen: 2004. Grønlands forhistorie.
    1. Gulløv H.C. The nature of contact between native Greenlanders and Norse. Journal of the North Atlantic. 2008;1:16–24.
    1. Appelt M., Gulløv H.C. Tunit, Norsemen, and Inuit in Thirteenth-Century Northwest Greenland: Dorset between the Devil and the Deep Sea. In: Maschner H., Mason O., McGhee R., editors. The Northern World AD 900–1400. University of Utah Press; Salt Lake City: 2009. pp. 300–320.
    1. Sørensen M., Gulløv H.C. The Prehistory of Inuit in Northeast Greenland. Arctic Anthropol. 2012;49:88–104.
    1. Gulløv H.C. On depopulation: A case study from Southeast Greenland. In: Appelt M., Berglund J., Gulløv H.C., editors. Identities and Cultural Contacts in the Arctic. Danish Polar Center; Copenhagen: 2000. pp. 43–54.

Publication types

Substances