. 2015 Jan 8;96(1):70-80.
doi: 10.1016/j.ajhg.2014.12.001. Epub 2014 Dec 31.

Biased allelic expression in human primary fibroblast single cells

Affiliations

Biased allelic expression in human primary fibroblast single cells

Christelle Borel et al. Am J Hum Genet. .

Abstract

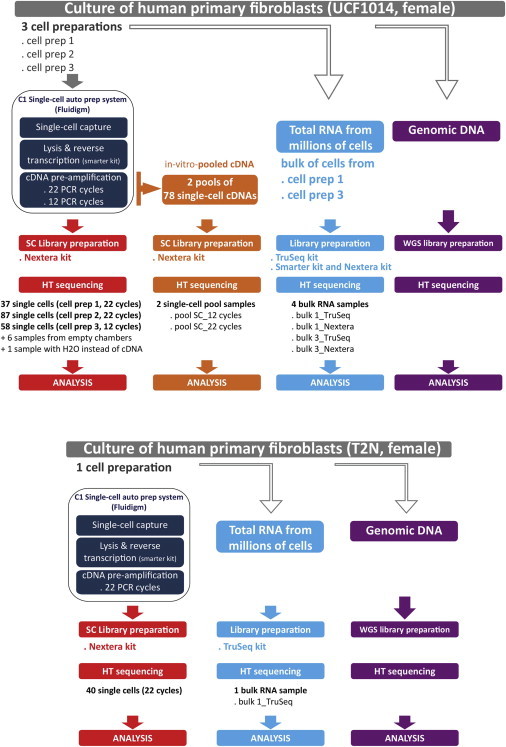
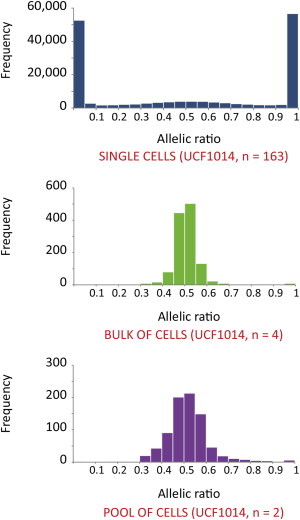
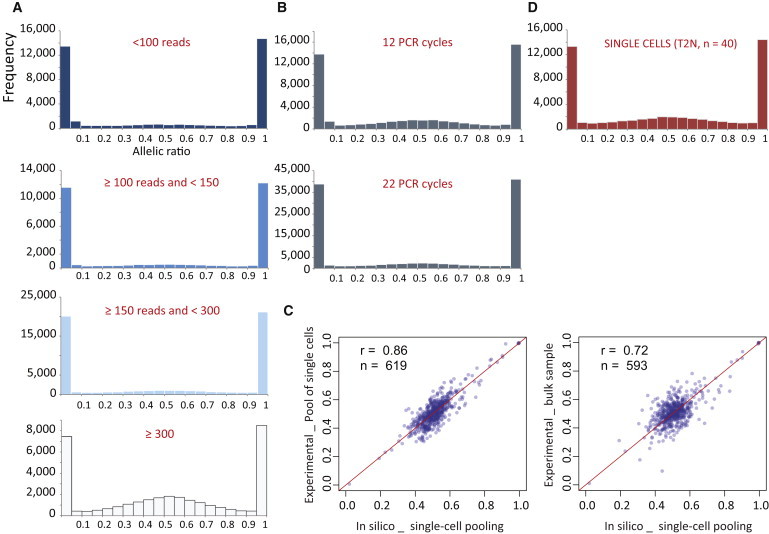
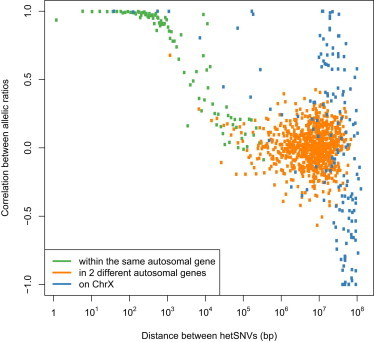
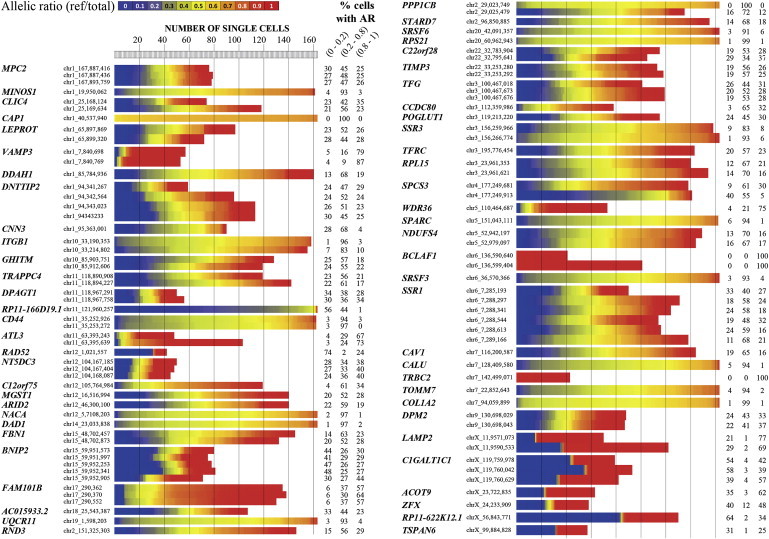
The study of gene expression in mammalian single cells via genomic technologies now provides the possibility to investigate the patterns of allelic gene expression. We used single-cell RNA sequencing to detect the allele-specific mRNA level in 203 single human primary fibroblasts over 133,633 unique heterozygous single-nucleotide variants (hetSNVs). We observed that at the snapshot of analyses, each cell contained mostly transcripts from one allele from the majority of genes; indeed, 76.4% of the hetSNVs displayed stochastic monoallelic expression in single cells. Remarkably, adjacent hetSNVs exhibited a haplotype-consistent allelic ratio; in contrast, distant sites located in two different genes were independent of the haplotype structure. Moreover, the allele-specific expression in single cells correlated with the abundance of the cellular transcript. We observed that genes expressing both alleles in the majority of the single cells at a given time point were rare and enriched with highly expressed genes. The relative abundance of each allele in a cell was controlled by some regulatory mechanisms given that we observed related single-cell allelic profiles according to genes. Overall, these results have direct implications in cellular phenotypic variability.


Figures

Figure 1
Figure 1
General Outline of the Experimental Workflow
Figure 2
Figure 2
ASE in Single Cells The histograms show the frequency distribution of the allelic ratio (reference reads per total reads) of 35,763 hetSNVs (≥20 RPSM) in 163 single cells (UCF1014 sample), bulk cell samples, and the pool of single-cell samples.
Figure 3
Figure 3
Estimation of the Technical Biases (A) Frequency-distribution histograms of the allelic ratio (reference reads per total reads) according to the read coverage at hetSNV position (35,763 hetSNVs, 163 UCF1014 single cells, ≥20 RPSM). (B) Frequency-distribution histograms of the allelic ratio of single cells (35,763 hetSNVs, UCF1014 single cells, ≥20 RPSM), for which the cDNA pre-amplification was performed with 22 or 12 PCR cycles. (C) Pairwise scatter plots for comparison of the allelic ratio between in silico pooling of single cells and experimental pooling (left panel) or bulk samples (right panel). Listed in the panel are the Pearson correlation coefficients (r) and the numbers of comparisons (n). The diagonal is plotted in red. (D) Independent experimental replication. Frequency-distribution histograms of the allelic ratio of single cells from T2N single-cell samples (40 single cells, 16,075 hetSNVs, ≥20 RPSM).
Figure 4
Figure 4
Relationship between hetSNVs Located within Genes or in Two Different Genes Scatter plots of allelic-ratio correlation versus genomic distance between two adjacent hetSNVs. hetSNVs located in the same autosomal genes are in green, hetSNVs located in different autosomal genes are in orange, and hetSNVs located on the X chromosome are in blue.
Figure 5
Figure 5
Pattern of Allelic Expression in Single Cells We selected genes for a representative view of the allelic expression in single cells. A complete overview is given in Figure S11. The index bar indicates the color coding for the allelic-ratio values (reference reads per total reads). Vertical dashed lines delineate a set of 20 single cells.
Figure 6
Figure 6
Relationship of mRNA Level and Allelic Ratio in Single Cells (A) A composite figure made of a scatter plot and a table. The scatter plot represents the mRNA level from single-cell RNA-seq data (UCF1014) against the minimum allelic ratio. The minimum allelic ratio is the absolute value of the difference between 0.5 and the allelic ratio (reference reads per total reads). For each gene, the average of RPSM values (coding regions and UTRs) for all single cells was calculated, log transformed (log2), and plotted on the y axis. Each data point represents one gene. Genes located on the X chromosome are included. The table on the right is the list of enriched gene-ontology (GO) terms with their respective p values (DAVID) for genes with RPSM values > 90. (B) Box plots of RNA half-life (left) or CAGE nuclear RNA (right) in three different groups of sites with variable allelic ratio (AR). tpm stands for the normalized raw CAGE tag count per million.

References

    1. Ferguson-Smith A.C. Genomic imprinting: the emergence of an epigenetic paradigm. Nat. Rev. Genet. 2011;12:565–575. - PubMed
    1. Reik W., Walter J. Genomic imprinting: parental influence on the genome. Nat. Rev. Genet. 2001;2:21–32. - PubMed
    1. Augui S., Nora E.P., Heard E. Regulation of X-chromosome inactivation by the X-inactivation centre. Nat. Rev. Genet. 2011;12:429–442. - PubMed
    1. Chow J.C., Yen Z., Ziesche S.M., Brown C.J. Silencing of the mammalian X chromosome. Annu. Rev. Genomics Hum. Genet. 2005;6:69–92. - PubMed
    1. Chess A., Simon I., Cedar H., Axel R. Allelic inactivation regulates olfactory receptor gene expression. Cell. 1994;78:823–834. - PubMed

Publication types