

Unique genomic profile of fibrolamellar hepatocellular carcinoma
- PMID: 25557953
- PMCID: PMC4521774
- DOI: 10.1053/j.gastro.2014.12.028
Unique genomic profile of fibrolamellar hepatocellular carcinoma
Abstract
Background & aims: Fibrolamellar hepatocellular carcinoma (FLC) is a rare primary hepatic cancer that develops in children and young adults without cirrhosis. Little is known about its pathogenesis, and it can be treated only with surgery. We performed an integrative genomic analysis of a large series of patients with FLC to identify associated genetic factors.
Methods: By using 78 clinically annotated FLC samples, we performed whole-transcriptome (n = 58), single-nucleotide polymorphism array (n = 41), and next-generation sequencing (n = 48) analyses; we also assessed the prevalence of the DNAJB1-PRKACA fusion transcript associated with this cancer (n = 73). We performed class discovery using non-negative matrix factorization, and functional annotation using gene-set enrichment analyses, nearest template prediction, ingenuity pathway analyses, and immunohistochemistry. The genomic identification of significant targets in a cancer algorithm was used to identify chromosomal aberrations, MuTect and VarScan2 were used to identify somatic mutations, and the random survival forest was used to determine patient prognoses. Findings were validated in an independent cohort.
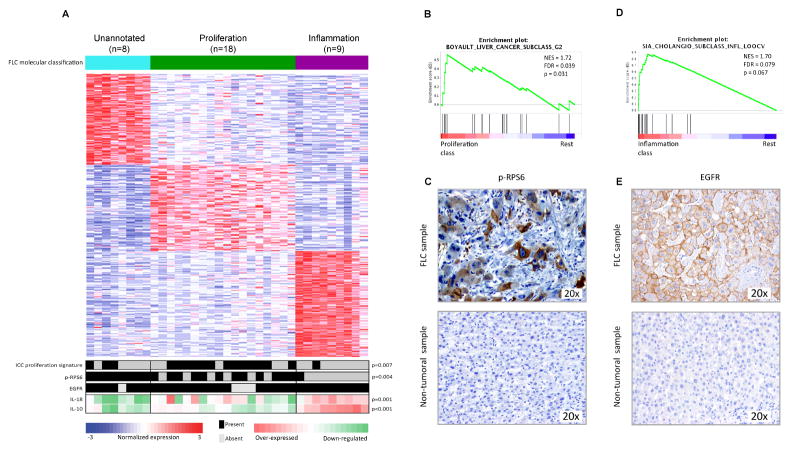
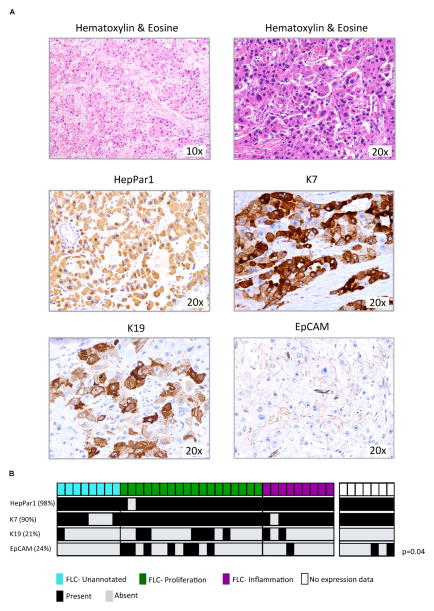
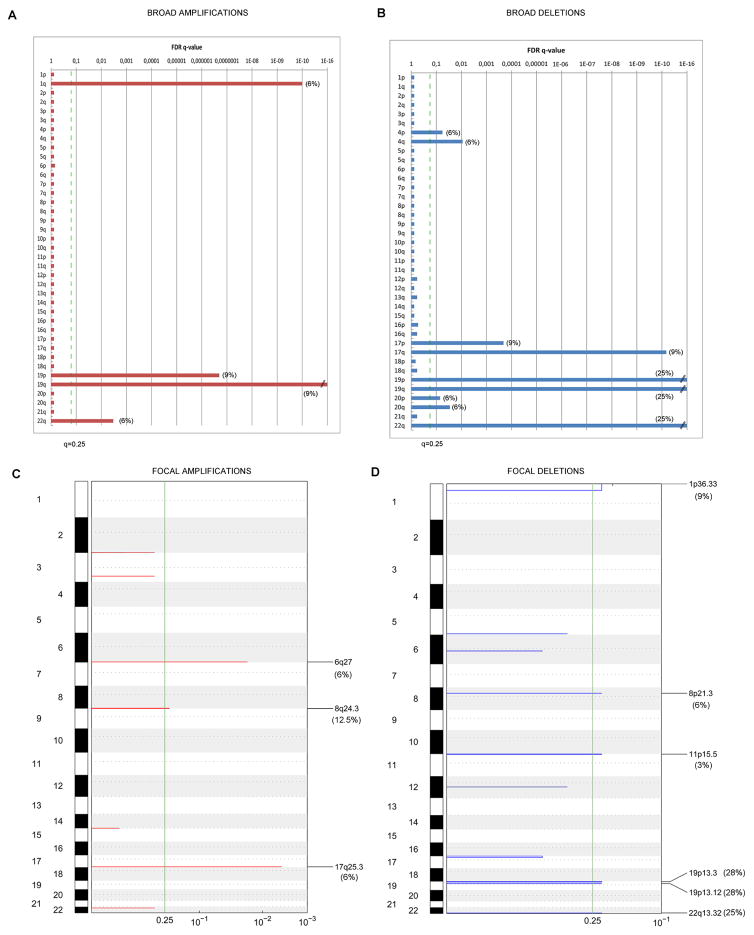
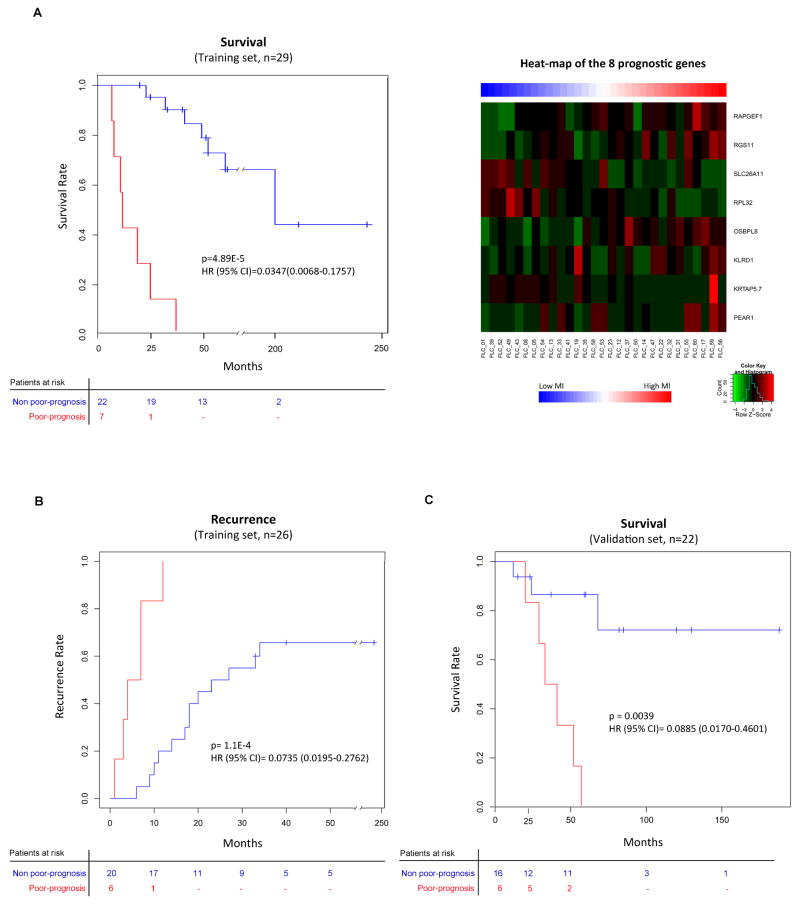
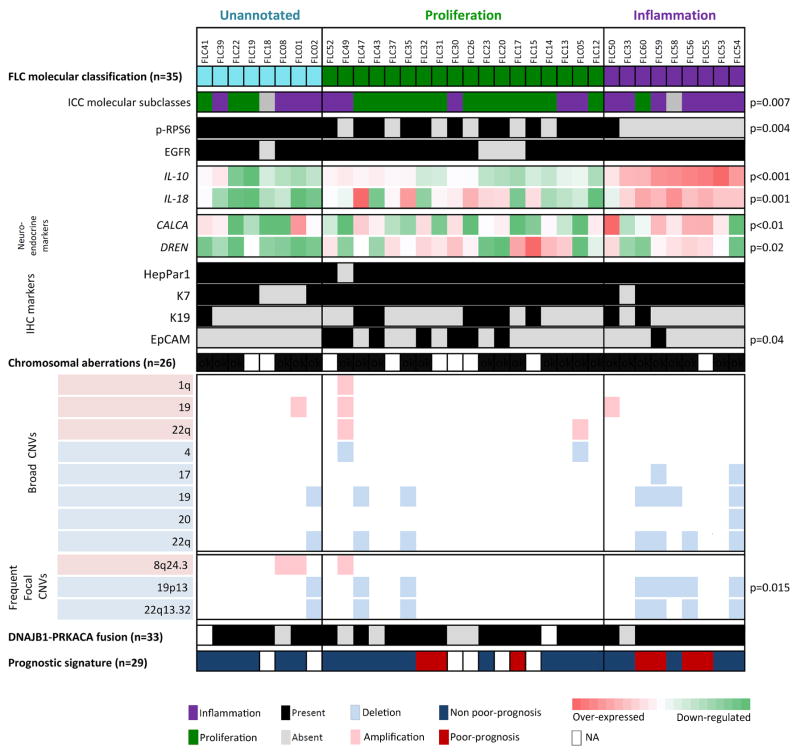
Results: Unsupervised gene expression clustering showed 3 robust molecular classes of tumors: the proliferation class (51% of samples) had altered expression of genes that regulate proliferation and mammalian target of rapamycin signaling activation; the inflammation class (26% of samples) had altered expression of genes that regulate inflammation and cytokine enriched production; and the unannotated class (23% of samples) had a gene expression signature that was not associated previously with liver tumors. Expression of genes that regulate neuroendocrine function, as well as histologic markers of cholangiocytes and hepatocytes, were detected in all 3 classes. FLCs had few copy number variations; the most frequent were focal amplification at 8q24.3 (in 12.5% of samples), and deletions at 19p13 (in 28% of samples) and 22q13.32 (in 25% of samples). The DNAJB1-PRKACA fusion transcript was detected in 79% of samples. FLC samples also contained mutations in cancer-related genes such as BRCA2 (in 4.2% of samples), which are uncommon in liver neoplasms. However, FLCs did not contain mutations most commonly detected in liver cancers. We identified an 8-gene signature that predicted survival of patients with FLC.
Conclusions: In a genomic analysis of 78 FLC samples, we identified 3 classes based on gene expression profiles. FLCs contain mutations and chromosomal aberrations not previously associated with liver cancer, and almost 80% contain the DNAJB1-PRKACA fusion transcript. By using this information, we identified a gene signature that is associated with patient survival time.
Keywords: Genomic Profiling; Molecular Classification; Outcome; Targeted Therapies.
Copyright © 2015 AGA Institute. Published by Elsevier Inc. All rights reserved.
Conflict of interest statement
Figures
Comment in
-
Fibrolamellar hepatocellular carcinoma: a rare but distinct type of liver cancer.Gastroenterology. 2015 Apr;148(4):707-10. doi: 10.1053/j.gastro.2015.02.039. Epub 2015 Feb 24. Gastroenterology. 2015. PMID: 25724459 No abstract available.
References
-
- El-Serag HB, Davila JA. Is fibrolamellar carcinoma different from hepatocellular carcinoma? A US population-based study. Hepatology. 2004;39:798–803. - PubMed
-
- EASL-EORTC clinical practice guidelines: management of hepatocellular carcinoma. J Hepatol. 2012;56:908–43. - PubMed
-
- Shaib Y, El-Serag HB. The epidemiology of cholangiocarcinoma. Semin Liver Dis. 2004;24:115–25. - PubMed
-
- Torbenson M. Review of the clinicopathologic features of fibrolamellar carcinoma. Adv Anat Pathol. 2007;14:217–23. - PubMed
Publication types
MeSH terms
Substances
Supplementary concepts
Grants and funding
LinkOut - more resources
Full Text Sources
Other Literature Sources
Medical
Molecular Biology Databases
Miscellaneous
