. 2015 Jan 13;10(2):292-305.
doi: 10.1016/j.celrep.2014.12.014. Epub 2014 Dec 31.

Mapping social behavior-induced brain activation at cellular resolution in the mouse

Affiliations

Mapping social behavior-induced brain activation at cellular resolution in the mouse

Yongsoo Kim et al. Cell Rep. .

Abstract

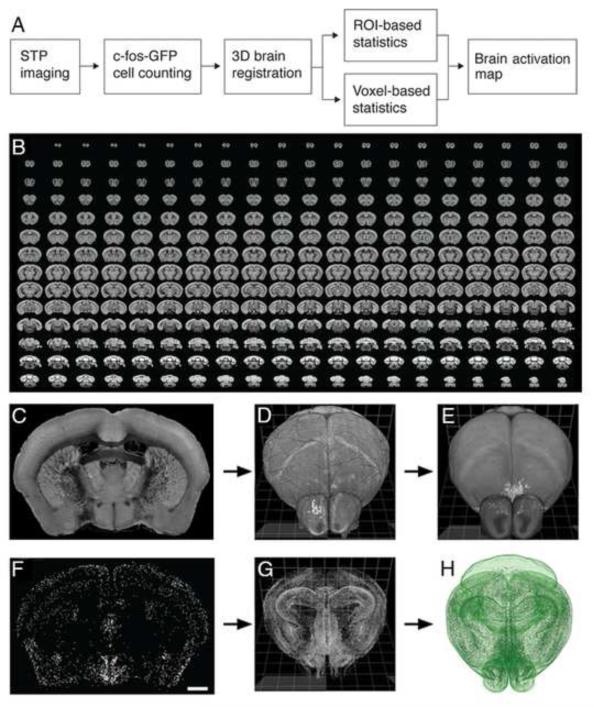
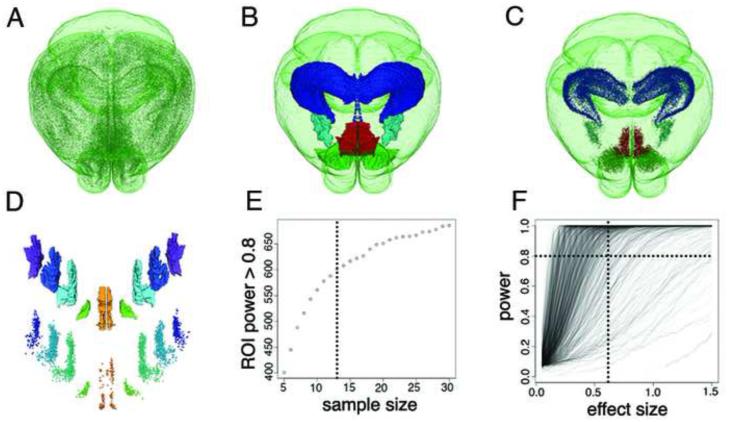
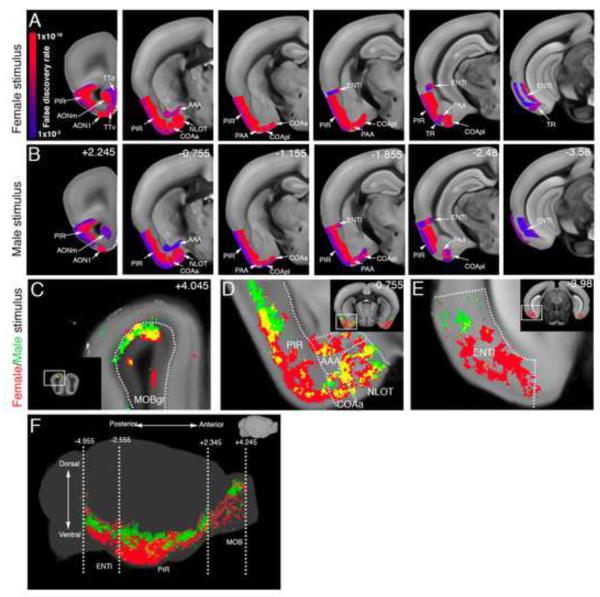
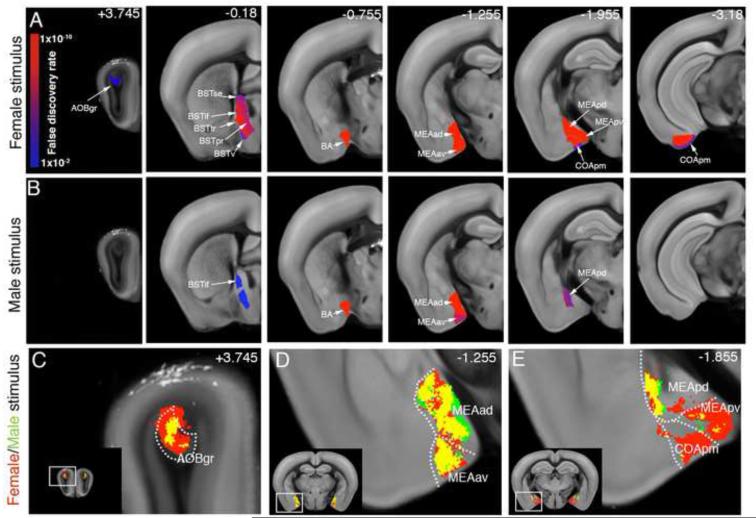
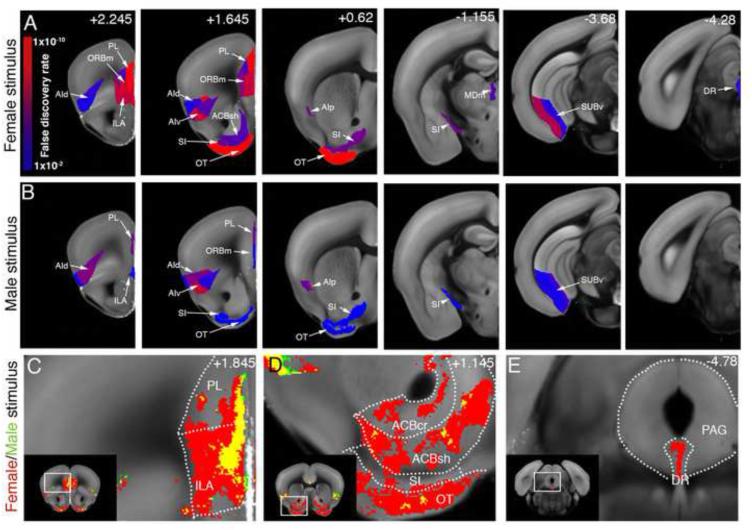
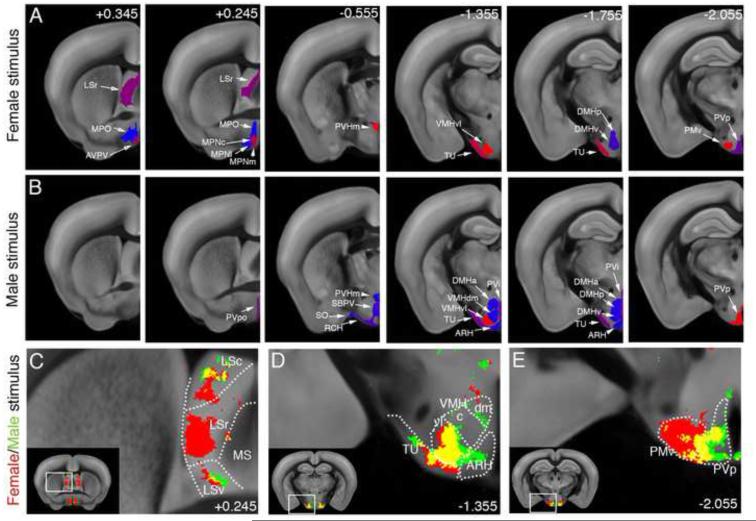
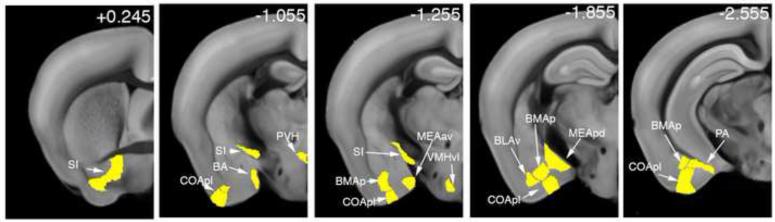
Understanding how brain activation mediates behaviors is a central goal of systems neuroscience. Here, we apply an automated method for mapping brain activation in the mouse in order to probe how sex-specific social behaviors are represented in the male brain. Our method uses the immediate-early-gene c-fos, a marker of neuronal activation, visualized by serial two-photon tomography: the c-fos-GFP+ neurons are computationally detected, their distribution is registered to a reference brain and a brain atlas, and their numbers are analyzed by statistical tests. Our results reveal distinct and shared female and male interaction-evoked patterns of male brain activation representing sex discrimination and social recognition. We also identify brain regions whose degree of activity correlates to specific features of social behaviors and estimate the total numbers and the densities of activated neurons per brain areas. Our study opens the door to automated screening of behavior-evoked brain activation in the mouse.


Figures

Figure 1
Figure 1. STP tomography and computational detection of c-fos-GFP positive cells
(A) Imaging and data processing pipeline for mapping whole-brain activation in c-fos-GFP mice. (B) A sample 280-serial section dataset of a c-fos-GFP mouse brain imaged by STP tomography. (C-H) Registration of CN-detected c-fos-GFP+ cells in the RSTP brain. (C) A coronal section shows the autofluorescence signal, which is used for registering the 3D reconstructed sample brain (D) onto the RSTP brain (E). (F) 2,177 c-fos-GFP+ cells were detected in the same coronal section; scale bar = 1 mm. (G) 360,183 c-fos-GFP+ cells were detected in the whole brain, reconstructed in 3D and (H) registered onto the RSTP brain using the image registration parameters established in the (D-E) step.
Figure 2
Figure 2. ROI-based segmentation and sample size calculation
(A-D) ROI-based segmentation of the whole-brain c-fos-GFP+ cell count. (A) Whole-brain view of 360,183 c-fos-GFP+ cells (same brain as in Figure 1H). (B) Examples of ABA ROI segmentation and (C) the corresponding c-fos-GFP+ cell counts: hippocampus—dark blue; 33,508 cells; medial amygdalar nucleus—light blue; 3,035 cells; nucleus accumbens—green; 13,627 cells; and infralimbic cortical area—red; 4,665 cells. (D) Further segmentation of the infralimbic region by cortical layers: top shows the layer ROIs, from layer 1 (orange) to layer 6 (purple); bottom shows the c-fos-GFP+ cell counts: ILA1 = 223, ILA2 = 243, ILA2/3 = 1,572, ILA5 = 1,731, ILA6 = 896 c-fos-GFP+ cells. The spacing between the layers was enlarged for better visualization. (E-F) Estimation of the sample size based on power analysis of c-fos-GFP+ cell counts. (E) The simulation of the relationship between the number of sufficiently powered ROIs and the sample size shows a steep increase till about N = 10, which then begins to plateau. For the current study we chose a sample size of N = 13 (dashed line). (F) The plot of the relationship between the statistical power of each ROI and the effect size for N = 13 group. Of the total 763 ROIs analyzed, 601 (78.8%) showed sufficient statistical power at the effect size 0.6 and 699 (91.6%) at the effect size 1.0.
Figure 3
Figure 3. Social behavior-activated areas: the MOB and its direct downstream circuitry
(A-B) ROI analysis: The male-female (A) and male-male groups (B) are compared to the handling group and significantly activated ROIs downstream of the MOB are displayed. Most of the regions were activated by both stimuli. Heatmap in (A) represents FDR corrected statistical significance. Numbers in (B) represent bregma A/P coordinates. See Table S2 for ROI full names. (C-F) Voxel based analysis revealed activation pattern selective for the female stimulus (red), the male stimulus (green), and shared by both stimuli (yellow). (C) Both male and female stimuli induced dorsal activation in the MOB. (D-F) Dorso-ventral separation was detected between the male- and female-evoked activation in the PIR (D, F) and ENT (E, F). See also Movie S3 for full dataset.
Figure 4
Figure 4. Social behavior-activated areas: the AOB and its direct downstream circuitry
(A-B) ROI analysis: The male-female (A) and male-male groups (B) are compared to the handling group and significantly activated ROIs downstream of the AOB are displayed. The female stimulus activated all AOB downstream regions, while the male stimulus induced only a partial activation of these areas. Heatmap in (A) represents FDR corrected statistical significance. Numbers in (B) represent bregma A/P coordinates. See Table S2 for ROI full names. (C-E) Voxel based analysis revealed a largely overlapping activation pattern (yellow) in the co-activated AOB (C), MEAad and MEAav (D), and MEApd (E), and selective female-evoked activation in the MEApv and COApm (E). See also Movie S3 for full dataset.
Figure 5
Figure 5. Social behavior-activated areas: Motivational circuitry
(A-B) ROI analysis: The male-female (A) and male-male groups (B) are compared to the handling group and significantly activated ROIs previously implicated in behavioral motivation are displayed. The female stimulus activated frontal cortical areas (PL, ORBm, ILA, AI), ventral striatum (OT, ACB, SI), midline thalamus (MDm), ventral hippocampus (SUBv), and seretonergic DR while the male stimulus activated AI, only superficial layer of PL, ORBm, and ILA, and weakly SI, OT, and SUBv. Heatmap in (A) represents FDR corrected statistical significance. Numbers in (B) represent bregma A/P coordinates. See Table S2 for ROI full names. (C-E) Voxel analysis showed that (C) the entire ventral part of PL and dorsal half of ILA was activated by the female stimulation, while only the upper layers of the same regions were activated by male stimulation. (D) Ventral striatum (ACB, SI, OT) showed patch shaped strong activation pattern by female stimulus, but not by male stimulus. (E) Voxel analysis pinpointed the maximal activation in the DR by the female stimulus at A/P coordinate −4.78.
Figure 6
Figure 6. Social behavior-activated areas: Septal and Hypothalamic activation
(A-B) ROI analysis: The male-female (A) and male-male groups (B) are compared to the handling group and significantly activated ROIs of the septum and hypothalamus are displayed. The female stimulus activated the rostral lateral septum (LSr), AVPV, medial preoptic area (MPO, MPN), PVH, TU, VMHvl, posterior and ventral DMH, PMv, and PVp. The male stimulus also activated the PVH, VMHvl, DMH (anterior part), TU, and PVp, in addition to a selective activation of the periventricular hypothalamic nuclei (PVpo, PVi), SBPV, RCH, SO, ARH, and VMHdm. Heatmap in (A) represents FDR corrected statistical significance. Numbers in (B) represent bregma A/P coordinates. See Table S2 for ROI full names. (C-D) Voxel analysis; (C) A distinct voxel activation was observed in the LSr only by female stimulation. (D) VMHvl showed largely overlapping activation by both stimuli, while VMHdm and ARH showed activation only by the male stimulus. (E) PMv is highly activated by the female stimulus, while the medial part of PMv was also activated by the male stimulus. See also Movie S3 for full dataset.
Figure 7
Figure 7. Social behavior-specific brain areas
Brain areas activated by both female and male stimulus, but not by ISO stimulation, are displayed as ROIs. Unique social behavior-activated areas included the amygdalar BA, COApl, MEAav, MEApd, BLAv, BMAp, PA, hypothalamic PVH, VMHvl, and ventral pallidum (SI).

References

    1. Anderson DJ. Optogenetics, sex, and violence in the brain: implications for psychiatry. Biological psychiatry. 2012;71:1081–1089. - PMC - PubMed
    1. Baum MJ, Kelliher KR. Complementary roles of the main and accessory olfactory systems in mammalian mate recognition. Annu Rev Physiol. 2009;71:141–160. - PubMed
    1. Bean NJ. Olfactory and vomeronasal mediation of ultrasonic vocalizations in male mice. Physiology & behavior. 1982;28:31–37. - PubMed
    1. Bialy M, Kaczmarek L. c-Fos expression as a tool to search for the neurobiological base of the sexual behaviour of males. Acta neurobiologiae experimentalis. 1996;56:567–577. - PubMed
    1. Brennan PA, Zufall F. Pheromonal communication in vertebrates. Nature. 2006;444:308–315. - PubMed

Publication types

Substances

LinkOut - more resources