

Quantification of Tc-99m-ethyl cysteinate dimer brain single photon emission computed tomography images using statistical probabilistic brain atlas in depressive end-stage renal disease patients: Correlation with disease severity and symptom factors
- PMID: 25558229
- PMCID: PMC4281418
- DOI: 10.3969/j.issn.1673-5374.2012.27.010
Quantification of Tc-99m-ethyl cysteinate dimer brain single photon emission computed tomography images using statistical probabilistic brain atlas in depressive end-stage renal disease patients: Correlation with disease severity and symptom factors
Abstract
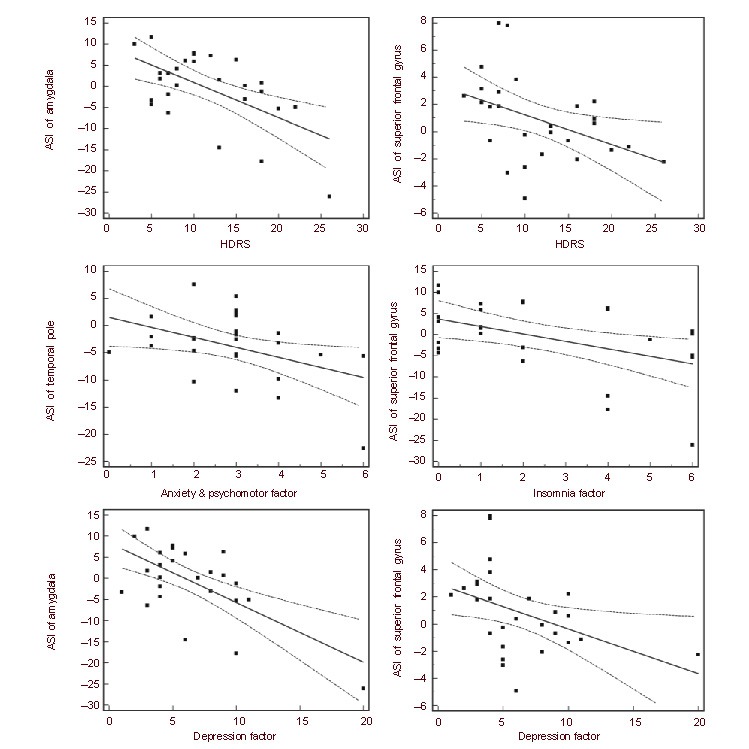
This study adapted a statistical probabilistic anatomical map of the brain for single photon emission computed tomography images of depressive end-stage renal disease patients. This research aimed to investigate the relationship between symptom clusters, disease severity, and cerebral blood flow. Twenty-seven patients (16 males, 11 females) with stages 4 and 5 end-stage renal disease were enrolled, along with 25 healthy controls. All patients underwent depressive mood assessment and brain single photon emission computed tomography. The statistical probabilistic anatomical map images were used to calculate the brain single photon emission computed tomography counts. Asymmetric index was acquired and Pearson correlation analysis was performed to analyze the correlation between symptom factors, severity, and regional cerebral blood flow. The depression factors of the Hamilton Depression Rating Scale showed a negative correlation with cerebral blood flow in the left amygdale. The insomnia factor showed negative correlations with cerebral blood flow in the left amygdala, right superior frontal gyrus, right middle frontal gyrus, and left middle frontal gyrus. The anxiety factor showed a positive correlation with cerebral glucose metabolism in the cerebellar vermis and a negative correlation with cerebral glucose metabolism in the left globus pallidus, right inferior frontal gyrus, both temporal poles, and left parahippocampus. The overall depression severity (total scores of Hamilton Depression Rating Scale) was negatively correlated with the statistical probabilistic anatomical map results in the left amygdala and right inferior frontal gyrus. In conclusion, our results demonstrated that the disease severity and extent of cerebral blood flow quantified by a probabilistic brain atlas was related to various brain areas in terms of the overall severity and symptom factors in end-stage renal disease patients.
Keywords: brain; cerebral blood flow; depression; disease severity; end-stage renal disease; neural regeneration; single photon emission computed tomography; statistical probabilistic brain atlas; symptom.
Conflict of interest statement
Figures

Similar articles
-
Statistical parametric mapping analysis of the relationship between regional cerebral blood flow and symptom clusters of the depressive mood in patients with pre-dialytic chronic kidney disease.Ann Nucl Med. 2008 Apr;22(3):201-6. doi: 10.1007/s12149-007-0108-x. Epub 2008 May 23. Ann Nucl Med. 2008. PMID: 18498035
-
Relationship between regional cerebral blood flow and separate symptom clusters of major depression: a single photon emission computed tomography study using statistical parametric mapping.Neurosci Lett. 2005 Aug 26;384(3):265-70. doi: 10.1016/j.neulet.2005.04.088. Neurosci Lett. 2005. PMID: 15921853 Clinical Trial.
-
Depressive mood in pre-dialytic chronic kidney disease: Statistical parametric mapping analysis of Tc-99m ECD brain SPECT.Psychiatry Res. 2009 Sep 30;173(3):243-7. doi: 10.1016/j.pscychresns.2008.08.007. Epub 2009 Aug 13. Psychiatry Res. 2009. PMID: 19682866
-
Correlation between neuropsychological tests and hypoperfusion in MCI patients: anatomical labeling using xjView and Talairach Daemon software.Ann Nucl Med. 2012 Oct;26(8):656-64. doi: 10.1007/s12149-012-0625-0. Epub 2012 Jul 10. Ann Nucl Med. 2012. PMID: 22777857
-
Neuroimaging Links Between Heart Failure and Depression-A Narrative Review.Brain Sci. 2024 Dec 20;14(12):1283. doi: 10.3390/brainsci14121283. Brain Sci. 2024. PMID: 39766482 Free PMC article. Review.
Cited by
-
Tc-99m TRODAT-1 SPECT is a Potential Biomarker for Restless Leg Syndrome in Patients with End-Stage.J Clin Med. 2020 Mar 24;9(3):889. doi: 10.3390/jcm9030889. J Clin Med. 2020. PMID: 32213981 Free PMC article.
References
-
- Geneva: World Health Organization; 2005. [accessed 4 April 2007]. Revised global burden of disease (GBD) 2002 estimates. http://www.who.int/healthinfo/bodgbd2002revised/en/index.html .
-
- Kimmel PL, Peterson RA, Weihs KL, et al. Psychosocial factors, behavioral compliance and survival in urban hemodialysis patients. Kidney Int. 1998;54(1):245–254. - PubMed
-
- Kimmel PL, Weihs KL, Peterson RA. Survival in hemodialysis patients: the role of depression. J Am Soc Nephrol. 1993;4(1):12–27. - PubMed
-
- Kimmel PL, Peterson RA. Depression in end-stage renal disease patients treated with hemodialysis: tools, correlates, outcomes, and needs. Semin Dial. 2005;18(2):91–97. - PubMed
-
- Cukor D, Peterson RA, Cohen SD, et al. Depression in end-stage renal disease hemodialysis patients. Nat Clin Pract Nephrol. 2006;2(12):678–687. - PubMed
LinkOut - more resources
Full Text Sources