. 2014 Oct;1(2):025001.
doi: 10.1117/1.NPh.1.2.025001.

Correspondence of electroencephalography and near-infrared spectroscopy sensitivities to the cerebral cortex using a high-density layout

Affiliations

Correspondence of electroencephalography and near-infrared spectroscopy sensitivities to the cerebral cortex using a high-density layout

Paolo Giacometti et al. Neurophotonics. 2014 Oct.

Abstract

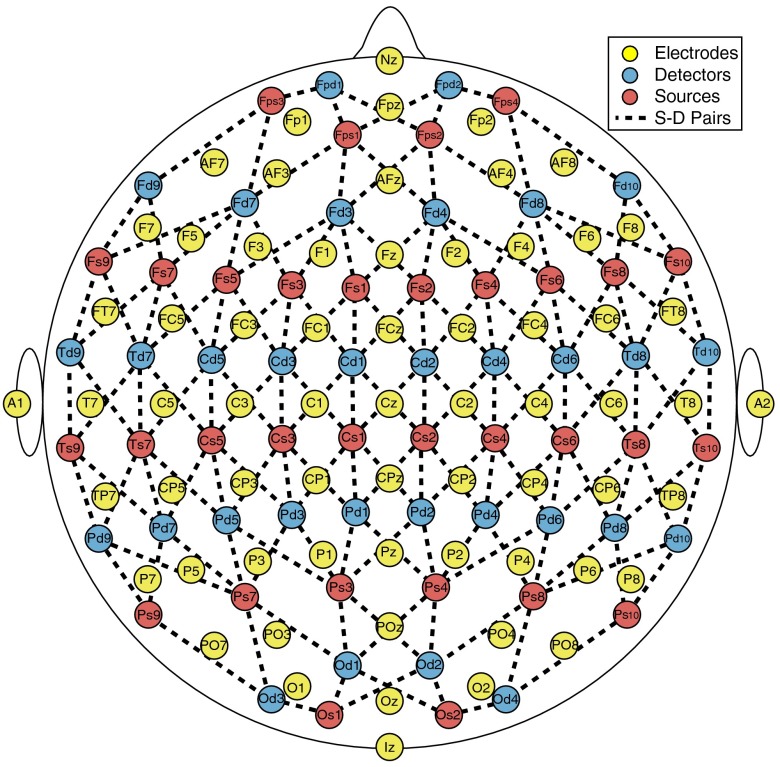
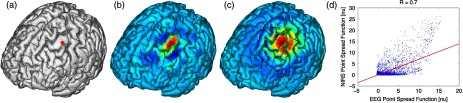
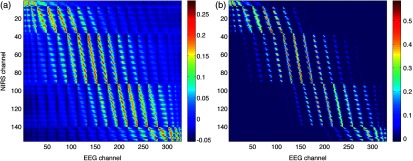
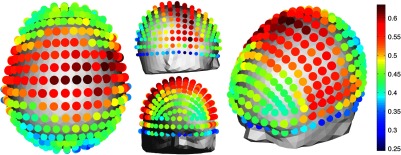
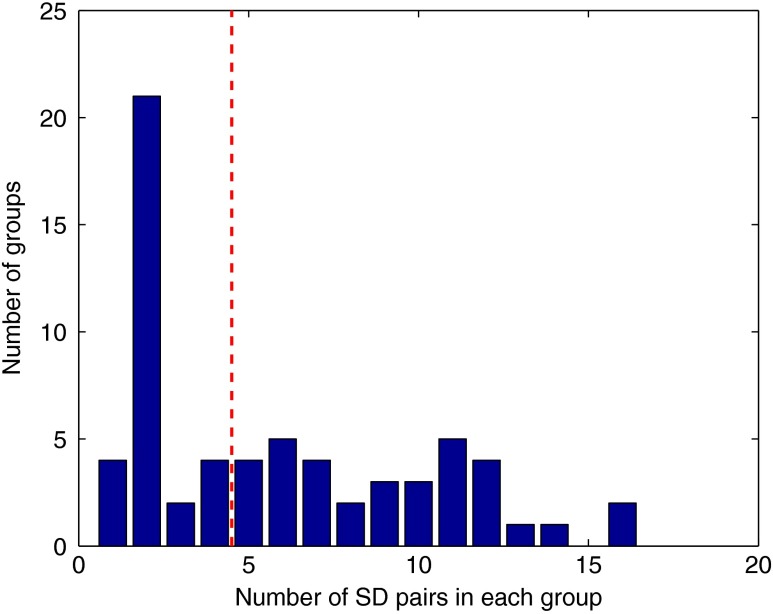
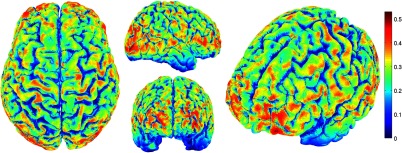
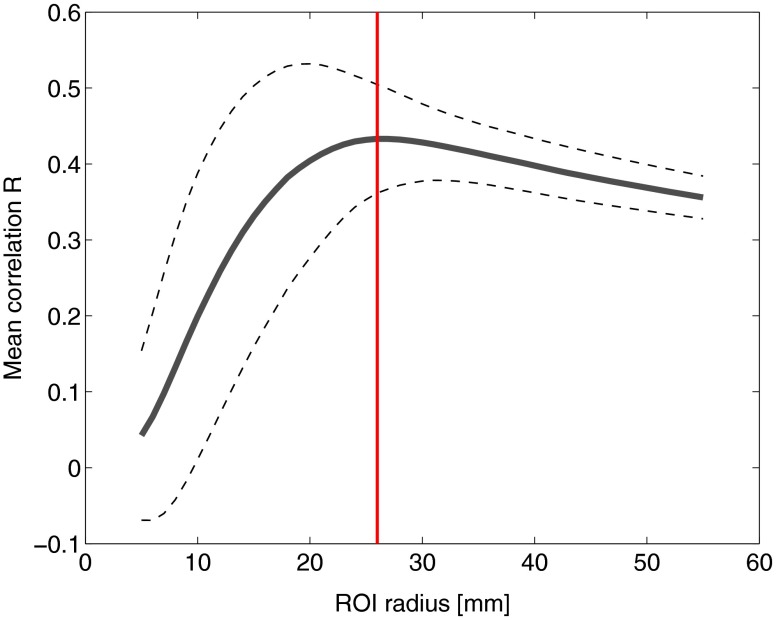
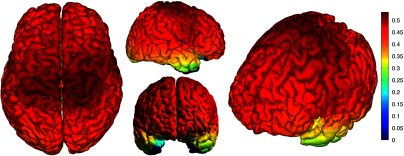
This study investigates the correspondence of the cortical sensitivity of electroencephalography (EEG) and near-infrared spectroscopy (NIRS). EEG forward model sensitivity to the cerebral cortex was calculated for 329 EEG electrodes following the 10-5 EEG positioning system using a segmented structural magnetic resonance imaging scan of a human subject. NIRS forward model sensitivity was calculated for the same subject using 156 NIRS source-detector pairs selected from 32 source and 32 detector optodes positioned on the scalp using a subset of the 10-5 EEG positioning system. Sensitivity correlations between colocalized NIRS source-detector pair groups and EEG channels yielded R = 0.46 ± 0.08. Groups of NIRS source-detector pairs with maximum correlations to EEG electrode sensitivities are tabulated. The mean correlation between the point spread functions for EEG and NIRS regions of interest (ROI) was R = 0.43 ± 0.07. Spherical ROIs with radii of 26 mm yielded the maximum correlation between EEG and NIRS averaged across all cortical mesh nodes. These sensitivity correlations between EEG and NIRS should be taken into account when designing multimodal studies of neurovascular coupling and when using NIRS as a statistical prior for EEG source localization.

Keywords: diffuse optical tomography; electroencephalography; forward model; inverse model; near-infrared spectroscopy; sensitivity.


Figures

Fig. 1
Fig. 1
Electrode and optode layouts and source-detector pair schematic. Note: Only 65 electrodes are displayed (10-10 positioning system) for the illustration purposes only. Also, source-detector distances are not representative of true separation.
Fig. 2
Fig. 2
(a) Histogram of source-detector pair separation distances. (b) Contrast-to-noise ratio (CNR) variance (CNRvar) for each source-detector pair versus its corresponding separation distance.
Fig. 3
Fig. 3
Method for calculation of nodal point spread function (PSF) correlation. (a) Selection of brain mesh node. (b) Near-infrared spectroscopy (NIRS) PSF for selected node. (c) Electroencephalography (EEG) PSF for selected node. (d) Correlation of R=0.7 between EEG (x-axis) and NIRS (y-axis) PSFs at selected node (normalized units).
Fig. 4
Fig. 4
(a) Method for the projection of scalp coordinates onto the surface of the cortex. (a1) Plane is fit to set of cortical mesh nodes (blue). (a2) Normal to plane (blue) that crosses scalp coordinate (green point in space) is selected. (a3) Intersection point between triangular mesh element and plane normal is calculated (red point on surface). (b) Regions of interest (ROI) selected throughout the brain. (The number of ROIs shown is less than the one used in the analysis for illustration purposes.) (c) Variable radius for a single ROI.
Fig. 5
Fig. 5
(a) Correlation between NIRS source-detector pair sensitivities and EEG electrode sensitivities. (b) Correlation between (noise-thresholded) EEG electrode sensitivity and (noise-thresholded) NIRS source-detector pair sensitivity. [The NIRS and EEG sensitivities were set to zero for CNR values below 0 dB].
Fig. 6
Fig. 6
Correlation between optimal NIRS source-detector pair group sensitivity and EEG electrode sensitivity for each corresponding EEG channel with mean R=0.46±0.08.
Fig. 7
Fig. 7
Histogram of optimal source-detector pair sensitivity groupings, displaying the amount of source-detector pairs required on each optimal group so that each group’s sensitivity achieves maximum correlation to the group’s corresponding EEG electrode. A subset of 65 electrodes was selected for this calculation based on the EEG 10-10 positioning layout. The red dashed line displays the threshold (k=4) for the optimal groups chosen.
Fig. 8
Fig. 8
Correlation between NIRS source-detector pair inverse model and EEG electrode inverse model for each brain mesh node with mean R=0.17±0.10.
Fig. 9
Fig. 9
Mean (bold line) and standard deviations (dashed lines) of the region of interest correlation between NIRS source-detector pair inverse model and EEG electrode inverse model for each ROI radius. The maximum mean correlation was obtained at a radius of 26 mm as marked with the vertical red line.
Fig. 10
Fig. 10
ROI correlation between NIRS source-detector pair inverse model and EEG electrode inverse model for ROI radius of 26 mm with mean R=0.43±0.07.

References

    1. Musha T., Okamoto Y., “Forward and inverse problems of EEG dipole localization,” Crit. Rev. Biomed. Eng. 27(3–5), 189–239 (1999). - PubMed
    1. Jurcak V., Tsuzuki D., Dan I., “10/20, 10/10, and 10/5 systems revisited: their validity as relative head-surface-based positioning systems,” NeuroImage 34(4), 1600–1611 (2007). 10.1016/j.neuroimage.2006.09.024 - DOI - PubMed
    1. Towle V. L., et al. , “The spatial location of EEG electrodes: locating the best-fitting sphere relative to cortical anatomy,” Electroencephalogr. Clin. Neurophysiol. 86(1), 1–6 (1993). 10.1016/0013-4694(93)90061-Y - DOI - PubMed
    1. Giacometti P., Diamond S. G., “Diffuse optical tomography for brain imaging: continuous wave instrumentation and linear analysis methods,” in Optical Methods and Instrumentation in Brain Imaging and Therapy, 1st ed., Madsen S. J., Ed., Chapter 3, pp. 57–85, Springer, New York: (2013).
    1. Iadecola C., “Neurovascular regulation in the normal brain and in Alzheimer’s disease,” Nat. Rev. 5(5), 347–360 (2004). 10.1038/nrn1387 - DOI - PubMed