

Using CellProfiler for Automatic Identification and Measurement of Biological Objects in Images
- PMID: 25559103
- PMCID: PMC4302752
- DOI: 10.1002/0471142727.mb1417s109
Using CellProfiler for Automatic Identification and Measurement of Biological Objects in Images
Abstract
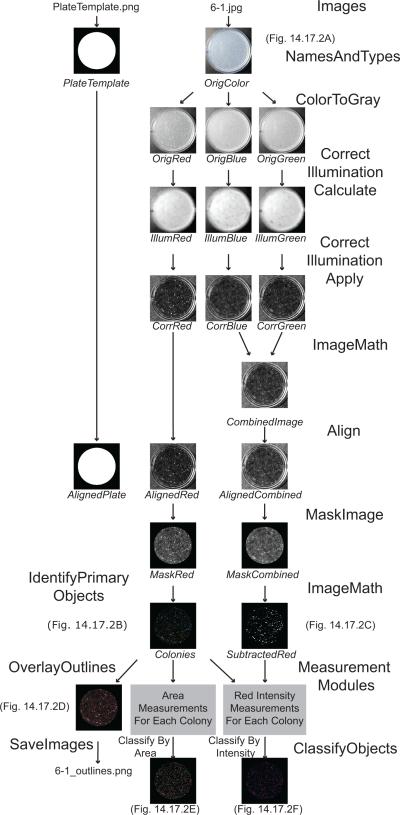
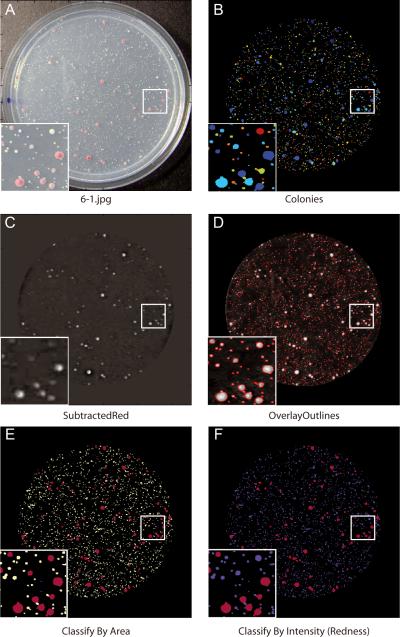
Visual analysis is required to perform many biological experiments, from counting colonies to measuring the size or fluorescence intensity of individual cells or organisms. This unit outlines the use of CellProfiler, a free, open-source image analysis tool that extracts quantitative information from biological images. It includes a step-by-step protocol for automated analysis of the number, color, and size of yeast colonies growing on agar plates, but the methods can be adapted to identify and measure many other types of objects in images. The flexibility of the software allows experimenters to create pipelines of adjustable modules to fit different biological experiments and to generate accurate measurements from dozens or even hundreds of thousands of images.
Keywords: automatic image analysis; colony counting; open-source software; phenotypes; yeast colonies.
Copyright © 2015 John Wiley & Sons, Inc.
Figures
References
-
- Dahle J, Kakar M, Steen HB, Kaalhus O. Automated counting of mammalian cell colonies by means of a flat bed scanner and image processing. Cytometry A. 2004;60(2):182–8. - PubMed
-
- Lamprecht MR, Sabatini DM, Carpenter AE. CellProfiler: free, versatile software for automated biological image analysis. Biotechniques. 2007;42(1):71–5. - PubMed
Publication types
MeSH terms
Substances
Grants and funding
LinkOut - more resources
Full Text Sources
Other Literature Sources
Molecular Biology Databases
