. 2015 Feb;16(2):188-96.
doi: 10.1038/ni.3077. Epub 2015 Jan 5.

Control of PI(3) kinase in Treg cells maintains homeostasis and lineage stability

Affiliations

Control of PI(3) kinase in Treg cells maintains homeostasis and lineage stability

Alexandria Huynh et al. Nat Immunol. 2015 Feb.

Abstract

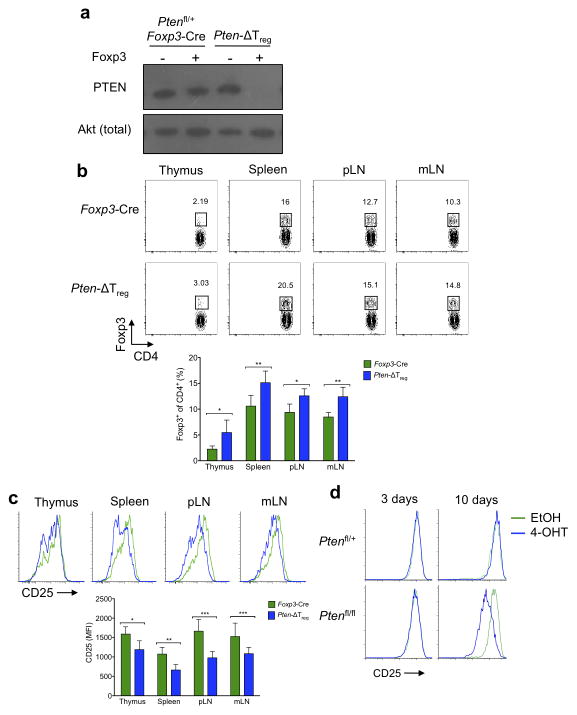
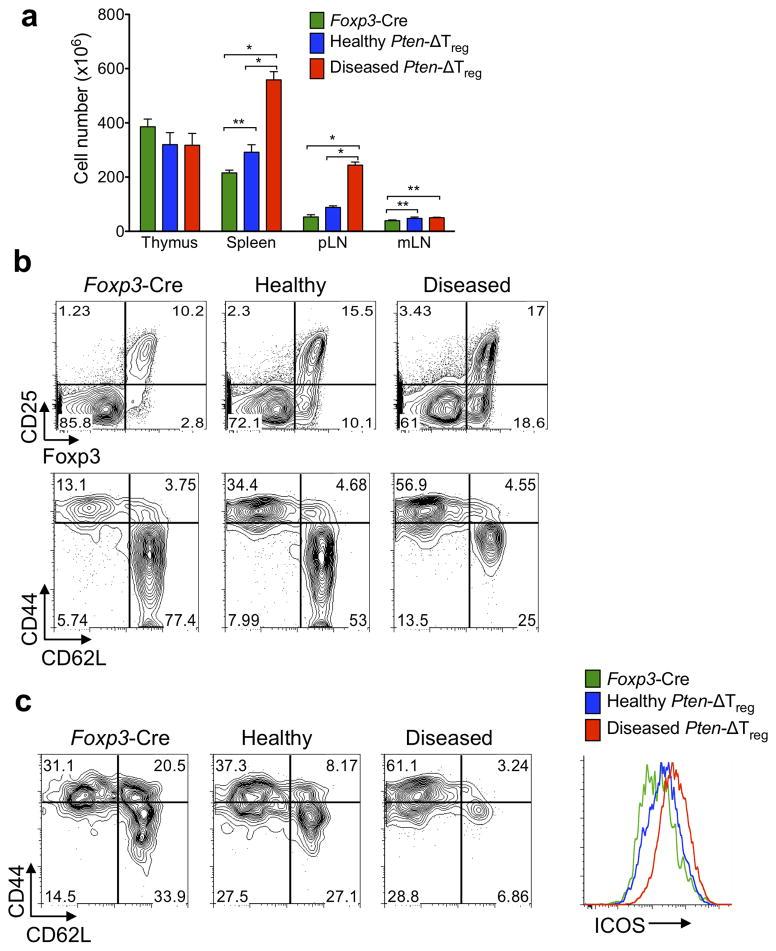
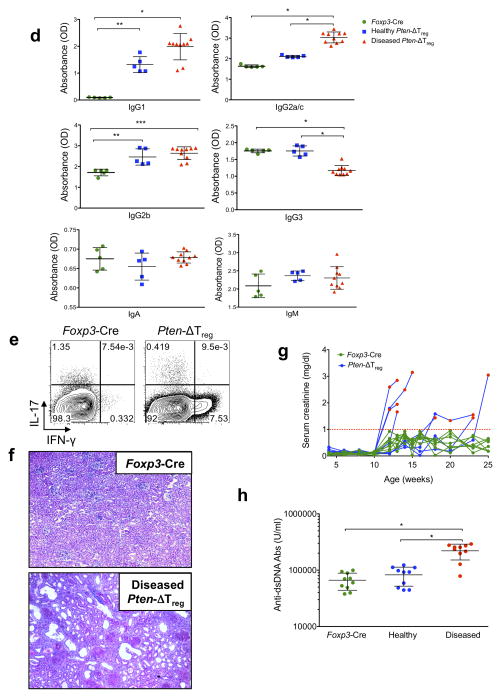
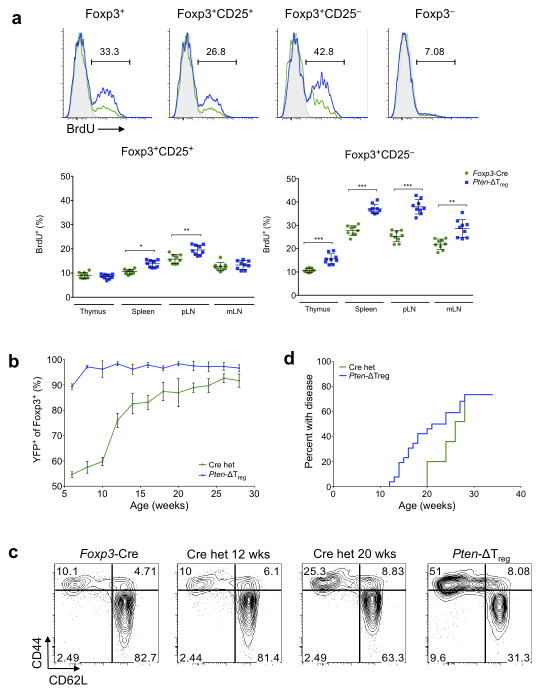
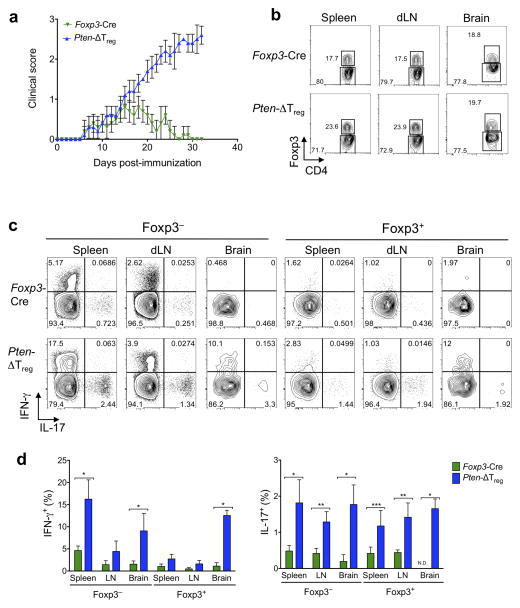
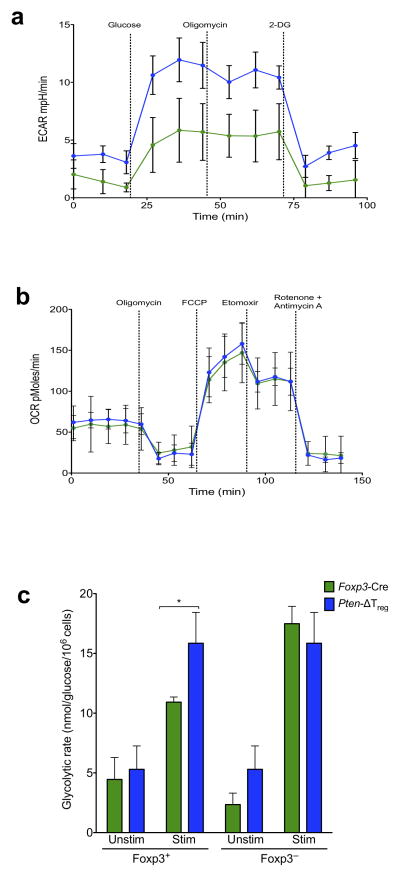
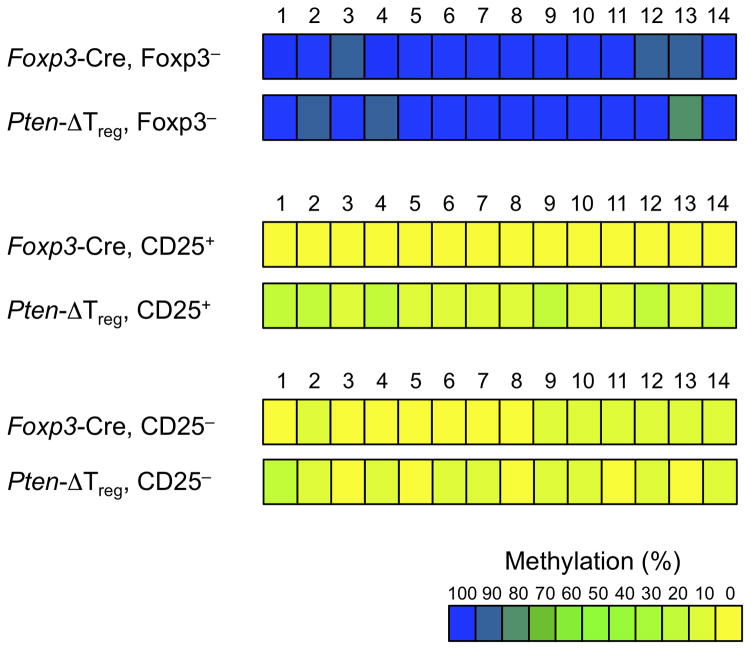
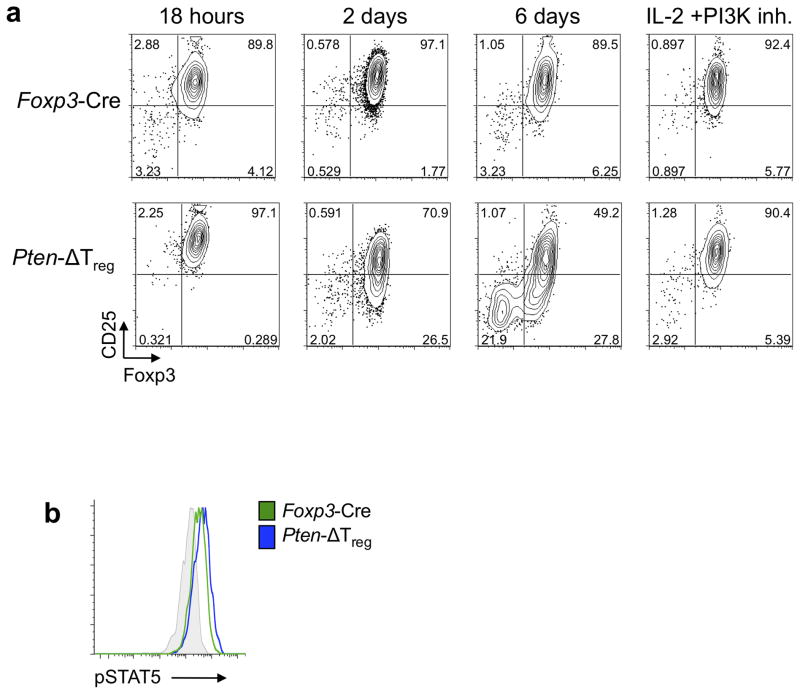
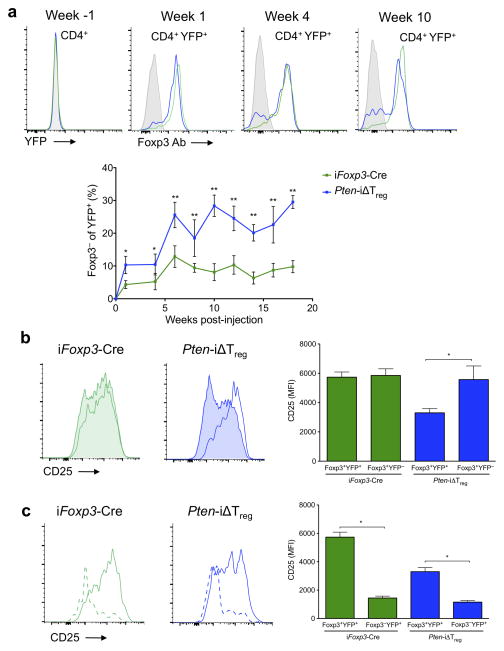
Foxp3(+) regulatory T cells (Treg cells) are required for immunological homeostasis. One notable distinction between conventional T cells (Tconv cells) and Treg cells is differences in the activity of phosphatidylinositol-3-OH kinase (PI(3)K); only Tconv cells downregulate PTEN, the main negative regulator of PI(3)K, upon activation. Here we found that control of PI(3)K in Treg cells was essential for lineage homeostasis and stability. Mice lacking Pten in Treg cells developed an autoimmune-lymphoproliferative disease characterized by excessive T helper type 1 (TH1) responses and B cell activation. Diminished control of PI(3)K activity in Treg cells led to reduced expression of the interleukin-2 (IL-2) receptor α subunit CD25, accumulation of Foxp3(+)CD25(-) cells and, ultimately, loss of expression of the transcription factor Foxp3 in these cells. Collectively, our data demonstrate that control of PI(3)K signaling by PTEN in Treg cells is critical for maintaining their homeostasis, function and stability.


Conflict of interest statement

Competing financial Interests

The authors declare a competing financial interest. For information see, xxxxxxxxxxx.

Figures

Figure 1
Figure 1
Characterization of Pten-ΔTreg mice. (a) Foxp3+ and Foxp3 cells were sort purified from the indicated mice and cell populations were analyzed by immunoblotting for PTEN and total Akt. (b) Analysis of CD4 and Foxp3 in cells isolated from the indicated tissues (pLN, peripheral lymph node; mLN, mesenteric lymph node). n = 10, representative of 10 experiments; *p < 0.001, **p < 0.0001 by two-way ANOVA. (c) Expression of CD25 on Foxp3+ cells isolated from thymus, spleen, pLN and mLN from Pten-ΔTreg and wild-type mice. n = 10, representative of 10 experiments; *p < 0.05, **p < 0.01, ***p < 0.001 by two-way ANOVA. (d) CD4+CD25+CD62L+ sorted Tregs from Ptenfl/+ or Ptenfl/fl Rosa26-CreER mice were cultured for the indicated times in vitro in the presence of 4-OH tamoxifen (4-OHT) to induce Cre-mediated excision of Pten and assessed for CD25 expression. Representative of 2 experiments. All error bars shown are mean ± SD.
Figure 2
Figure 2
Pten-ΔTreg mice develop spontaneous systemic lymphoproliferative disease with age. (a) (Left) Cell numbers from the indicated tissues of Foxp3-Cre control mice, healthy appearing Pten-ΔTreg mice, and diseased Pten-ΔTreg mice (as assessed by gross lymphadenopathy, typical age 15 – 18 weeks). n = 3 for diseased Pten-ΔTreg or 5 for other groups; representative of 5 experiments; *p < 0.0001, **p < 0.01 by two-way ANOVA. (b) Flow cytometric analysis of CD4+ cells (top) and CD4+Foxp3 cells (bottom) from spleen of wild-type mice, Pten-ΔTreg mice, and diseased Pten-ΔTreg mice. Representative of 10 experiments. (c) Foxp3+ Tregs were isolated from wild-type, Pten-ΔTreg and diseased Pten-ΔTreg mice and analyzed for expression of CD44, CD62L and ICOS. Representative of 10 experiments. (d) Serum IgG1, IgG3a/c, IgG2b, IgG3, IgA and IgM concentrationss from the three groups of mice as defined above. n = 10 for diseased Pten-ΔTreg and 5 for other groups, representative of 3 experiments; *p < 0.0001, **p < 0.001, ***p = 0.0001 by one-way ANOVA. (e) CD4+ cells from lymph nodes of control mice and diseased Pten-ΔTreg mice were isolated, restimulated ex vivo and stained for IFN-γ and IL-17, representative of 5 experiments. (f) Hematoxylin and eosin staining of renal tissue from a representative wild-type (top) and Pten-ΔTreg mouse (bottom); 10x magnification. (g) Serum creatinine concentrations in Pten-ΔTreg mice with age. n = 8, representative of 2 experiments. Red symbols indicate age at which visible lymphadenopathy occurred; red line indicates the level at which kidney failure is diagnosed in mice. (h) Anti-double stranded DNA antibody concentrations in Pten-ΔTreg mice. n = 10, representative of 2 experiments; *p < 0.0001 by one-way ANOVA. All error bars shown are mean ± SD.
Figure 2
Figure 2
Pten-ΔTreg mice develop spontaneous systemic lymphoproliferative disease with age. (a) (Left) Cell numbers from the indicated tissues of Foxp3-Cre control mice, healthy appearing Pten-ΔTreg mice, and diseased Pten-ΔTreg mice (as assessed by gross lymphadenopathy, typical age 15 – 18 weeks). n = 3 for diseased Pten-ΔTreg or 5 for other groups; representative of 5 experiments; *p < 0.0001, **p < 0.01 by two-way ANOVA. (b) Flow cytometric analysis of CD4+ cells (top) and CD4+Foxp3 cells (bottom) from spleen of wild-type mice, Pten-ΔTreg mice, and diseased Pten-ΔTreg mice. Representative of 10 experiments. (c) Foxp3+ Tregs were isolated from wild-type, Pten-ΔTreg and diseased Pten-ΔTreg mice and analyzed for expression of CD44, CD62L and ICOS. Representative of 10 experiments. (d) Serum IgG1, IgG3a/c, IgG2b, IgG3, IgA and IgM concentrationss from the three groups of mice as defined above. n = 10 for diseased Pten-ΔTreg and 5 for other groups, representative of 3 experiments; *p < 0.0001, **p < 0.001, ***p = 0.0001 by one-way ANOVA. (e) CD4+ cells from lymph nodes of control mice and diseased Pten-ΔTreg mice were isolated, restimulated ex vivo and stained for IFN-γ and IL-17, representative of 5 experiments. (f) Hematoxylin and eosin staining of renal tissue from a representative wild-type (top) and Pten-ΔTreg mouse (bottom); 10x magnification. (g) Serum creatinine concentrations in Pten-ΔTreg mice with age. n = 8, representative of 2 experiments. Red symbols indicate age at which visible lymphadenopathy occurred; red line indicates the level at which kidney failure is diagnosed in mice. (h) Anti-double stranded DNA antibody concentrations in Pten-ΔTreg mice. n = 10, representative of 2 experiments; *p < 0.0001 by one-way ANOVA. All error bars shown are mean ± SD.
Figure 3
Figure 3
Expansion of PTEN-deficient Tregs in vivo. (a) Wild-type and Pten-ΔTreg mice were injected i.p. with BrdU every 12 h for 3 consecutive days. Cells were isolated from thymus, spleen, pLN and mLN and assessed for BrdU incorporation. n = 9, representative of 4 experiments; *p < 0.001, **p < 0.002, ***p < 0.0001 by t-test. (b) Female Ptenfl/fl mice were bred to express one allele of Foxp3-Cre (Cre heterozygous mice) and followed over time along with female Pten-ΔTreg mice (homozygous for Foxp3-Cre). n = 20. (c) Flow cytometric analysis of peripheral blood CD4+Foxp3 T cells from mice as in panel b plus a wild-type Foxp3-Cre control mouse. (d) Aged Ptenfl/fl Cre heterozygous female mice develop disease similar to Pten-ΔTreg mice with delayed onset, n = 20 (Cre het) or 35 (Pten-ΔTreg). All error bars shown are mean ± SD.
Figure 4
Figure 4
Loss of PTEN prevents the ability of Tregs to resolve autoimmune inflammation. (a) Wild-type and Pten-ΔTreg mice were immunized s.c. with myelin oligodendrocyte peptide emulsified in complete Freund’s adjuvant (CFA) to induce experimental autoimmune encephalomyelitis (EAE), and clinical disease severity was monitored for 35 days post-immunization. n = 10, representative of 3 experiments; p < 0.0001 by two-way ANOVA. (b) Representative flow cytometric analysis for CD4 and Foxp3 in the spleen, draining lymph nodes and brain of mice in panel a at day 35. (c) T cells as in panel b were restimulated ex vivo and assessed for production of IFN-γ and IL-17. Left set of panels are gated on CD4+Foxp3 cells and the right set of panels are gated on CD4+Foxp3+ cells. n = 5, representative of 3 experiments. (d) Compilation of data from the experiments in c. N.D. = not detected; *p < 0.0001, **p < 0.001, ***p < 0.01 by two-way ANOVA. All error bars shown are mean ± SD.
Figure 5
Figure 5
PTEN deficiency skews Treg metabolism toward glycolysis. (a,b) Tregs from Pten-ΔTreg and wild-type mice were purified and subjected to a glycolysis stress (a) or mito-stress test (b) to assess the bioenergetic profile of these cells. n = 3 samples per group, representative of 2 experiments. (c) The indicated populations of cells were isolated from Pten-ΔTreg or wild-type mice, stimulated and treated with [3-3H] glucose to measure the generation of 3H2O as an indicator of the glycolytic rate of cells. n = 4, representative of 3 experiments; *p < 0.01 by two-way ANOVA. All error bars shown are mean ± SD.
Figure 6
Figure 6
TSDR methylation analysis. Methylation status of CpG motifs of the Foxp3 locus was assessed by bisulfite sequencing of the indicated populations of sorted cells (data were averaged from 4 – 5 mice per group and > 76 total sequences per group).
Figure 7
Figure 7
PTEN deletion leads to Treg instability in vitro. (a) CD4+Foxp3+CD25+ iTregs from Ptenfl/fl Foxp3GFP-hCre mice with indicated genotypes were sorted and cultured in the presence of IL-2 with or without the PI3K inhibitor (10 μM LY294002) for 6 d and expression of Foxp3 and CD25 was monitored at indicated times. Representative of 3 experiments. (b) Foxp3+ cells were isolated from wild-type and Pten-ΔTreg mice, serum starved for 1 h and stimulated for 30 min in the presence of 200 IU/ml hIL-2. Cells were then immediately fixed, permeabilized and assessed for pSTAT5 levels by phospho-flow cytometry. Grey = isotype control. Representative of 3 experiments.
Figure 8
Figure 8
PTEN deletion leads to Treg instability in vivo. Control and Pten-iΔTreg mice were treated with a 5 d course of tamoxifen as per Materials and Methods. Peripheral blood was assessed at the indicated time points. (a) Detection and quantification of ‘ex’-Foxp3 cells. All plots are gated on CD4+YFP+ cells, except Week -1, which is gated on total CD4+ cells. n = 5, representative of 3 experiments; *p <0.05, **p < 0.0001 by two-way ANOVA. (b) Expression of CD25 on Foxp3+ cells. CD25 staining of Foxp3+YFP+ Tregs (unshaded) and Foxp3+YFP (shaded) unlabeled Tregs from a representative animal at week 20 as per panel a. n = 5, representative of 3 experiments, *p < 0.0001 by two-way ANOVA. (c) Expression of CD25 on ‘ex’-Foxp3 cells. CD25 staining of Foxp3YFP+ (dashed) and Foxp3+YFP+ (solid) cells for the animal shown in panel b. n = 5, representative of 3 experiments; *p < 0.0001 by two-way ANOVA. All error bars are mean ± SD.

Comment in

References

    1. Hori S, Nomura T, Sakaguchi S. Control of regulatory T cell development by the transcription factor Foxp3. Science. 2003;299:1057–1061. - PubMed
    1. Fontenot JD, Gavin MA, Rudensky AY. Foxp3 programs the development and function of CD4+CD25+ regulatory T cells. Nature immunology. 2003;4:330–336. - PubMed
    1. Huynh A, Zhang R, Turka LA. Signals and pathways controlling regulatory T cells. Immunol Rev. 2014;258:117–131. - PubMed
    1. Webster KE, et al. In vivo expansion of T reg cells with IL-2-mAb complexes: induction of resistance to EAE and long-term acceptance of islet allografts without immunosuppression. J Exp Med. 2009;206:751–760. - PMC - PubMed
    1. Burchill MA, Yang J, Vogtenhuber C, Blazar BR, Farrar MA. IL-2 receptor beta-dependent STAT5 activation is required for the development of Foxp3+ regulatory T cells. J Immunol. 2007;178:280–290. - PubMed

Publication types

Substances