

Rational design of viscosity reducing mutants of a monoclonal antibody: hydrophobic versus electrostatic inter-molecular interactions
- PMID: 25559441
- PMCID: PMC4622976
- DOI: 10.4161/19420862.2014.985504
Rational design of viscosity reducing mutants of a monoclonal antibody: hydrophobic versus electrostatic inter-molecular interactions
Abstract
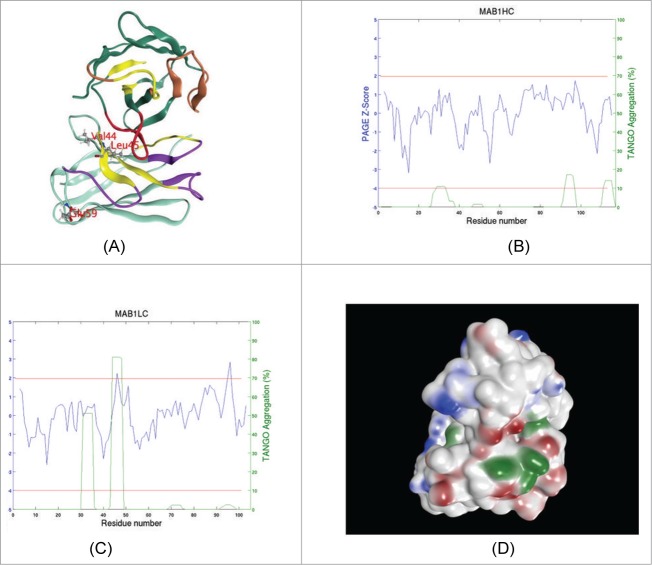
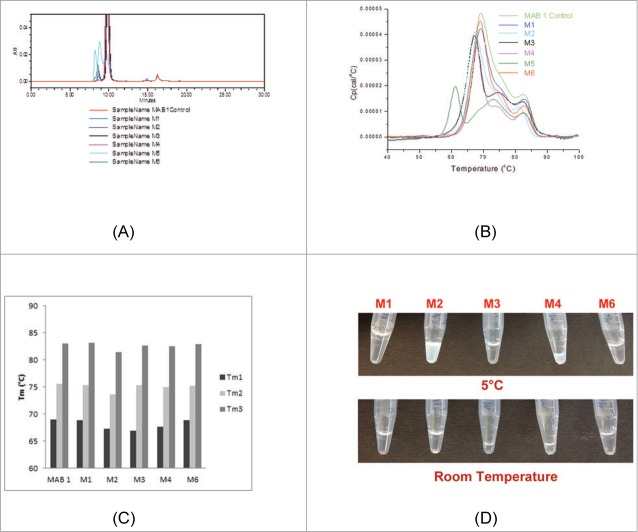
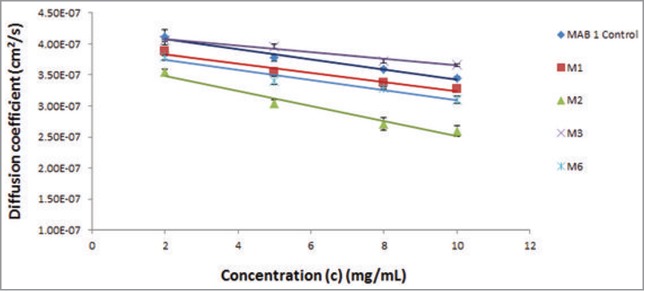
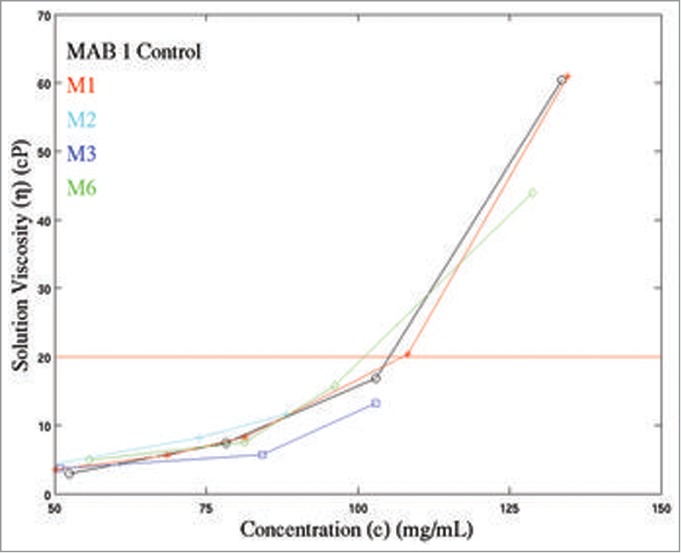
High viscosity of monoclonal antibody formulations at concentrations ≥100 mg/mL can impede their development as products suitable for subcutaneous delivery. The effects of hydrophobic and electrostatic intermolecular interactions on the solution behavior of MAB 1, which becomes unacceptably viscous at high concentrations, was studied by testing 5 single point mutants. The mutations were designed to reduce viscosity by disrupting either an aggregation prone region (APR), which also participates in 2 hydrophobic surface patches, or a negatively charged surface patch in the variable region. The disruption of an APR that lies at the interface of light and heavy chain variable domains, VH and VL, via L45K mutation destabilized MAB 1 and abolished antigen binding. However, mutation at the preceding residue (V44K), which also lies in the same APR, increased apparent solubility and reduced viscosity of MAB 1 without sacrificing antigen binding or thermal stability. Neutralizing the negatively charged surface patch (E59Y) also increased apparent solubility and reduced viscosity of MAB 1, but charge reversal at the same position (E59K/R) caused destabilization, decreased solubility and led to difficulties in sample manipulation that precluded their viscosity measurements at high concentrations. Both V44K and E59Y mutations showed similar increase in apparent solubility. However, the viscosity profile of E59Y was considerably better than that of the V44K, providing evidence that inter-molecular interactions in MAB 1 are electrostatically driven. In conclusion, neutralizing negatively charged surface patches may be more beneficial toward reducing viscosity of highly concentrated antibody solutions than charge reversal or aggregation prone motif disruption.
Keywords: APR, Aggregation Prone Region; ASA, Accessible Surface Area; ASAFv-HPH, hydrophilic accessible surface area of the Fv portion; ASAFv-HYD, hydrophobic accessible surface area of the Fv portion; CE, Capillary Electrophoresis; CH2; CH3, third constant domain in heavy chain; CHO, Chinese Hamster Ovary; D0, diffusion coefficient at infinite dilution; DFv, dipole moment of Fv; DLS, Dynamic Light Scattering; ELISA, Enzyme-Linked Immunosorbent Assay; Fab, fragment antigen binding; Fc, fragment crystallizable; Fv, fragment variable; HC, heavy chain; IgG, immunoglobulin G; LC, light chain; MAB 1 Control, MAB 1 expressed in CHO cells; MD, molecular dynamics; NTU, Nephelometric Turbidity Unit; PEG, polyethylene glycol; Pagg-VH, aggregation propensity of VH domain; Pagg-VL, aggregation propensity of VL domain; RPM, revolutions per minute; SE-HPLC, Size Exclusion High Performance Liquid Chromatography; Tm, thermal transition temperature; VH, variable domain in the heavy chain; VL, variable domain in the light chain; ZDHH, Debye-Huckel Henry Charge; ZFv, net charge of the Fv; ZFv-app, apparent charge of the Fv; aggregation prone regions; cIEF, capillary Isoelectric Focusing; cP, centipoise; high concentration; kD, protein-protein interaction parameter; mAb, monoclonal antibody; molecular modeling; monoclonal antibodies; negatively charged patches; rational design; second constant domain in the heavy chain; solubility; viscosity; ΔGFv, change in Free energy of Fv; η, solution viscosity; η0, solvent viscosity; ηrel, relative viscosity; ξFv, zeta-potential of the Fv.
Figures
Similar articles
-
Differences in human IgG1 and IgG4 S228P monoclonal antibodies viscosity and self-interactions: Experimental assessment and computational predictions of domain interactions.MAbs. 2021 Jan-Dec;13(1):1991256. doi: 10.1080/19420862.2021.1991256. MAbs. 2021. PMID: 34747330 Free PMC article.
-
Hydrogen exchange mass spectrometry reveals protein interfaces and distant dynamic coupling effects during the reversible self-association of an IgG1 monoclonal antibody.MAbs. 2015;7(3):525-39. doi: 10.1080/19420862.2015.1029217. MAbs. 2015. PMID: 25875351 Free PMC article.
-
Correlations between changes in conformational dynamics and physical stability in a mutant IgG1 mAb engineered for extended serum half-life.MAbs. 2015;7(1):84-95. doi: 10.4161/19420862.2014.985494. MAbs. 2015. PMID: 25524268 Free PMC article.
-
Full-length recombinant antibodies from Escherichia coli: production, characterization, effector function (Fc) engineering, and clinical evaluation.MAbs. 2022 Jan-Dec;14(1):2111748. doi: 10.1080/19420862.2022.2111748. MAbs. 2022. PMID: 36018829 Free PMC article. Review.
-
Pharmacokinetics and biodistribution of genetically-engineered antibodies.Q J Nucl Med. 1998 Dec;42(4):225-41. Q J Nucl Med. 1998. PMID: 9973838 Review.
Cited by
-
Multiscale Coarse-Grained Approach to Investigate Self-Association of Antibodies.Biophys J. 2020 Jun 2;118(11):2741-2754. doi: 10.1016/j.bpj.2020.04.022. Epub 2020 Apr 29. Biophys J. 2020. PMID: 32416079 Free PMC article.
-
Electrostatic engineering of the interface between heavy and light chains promotes antibody Fab fragment production.Cytotechnology. 2017 Jun;69(3):469-475. doi: 10.1007/s10616-016-9955-4. Epub 2016 Feb 8. Cytotechnology. 2017. PMID: 26856589 Free PMC article.
-
Non-specificity as the sticky problem in therapeutic antibody development.Nat Rev Chem. 2022 Dec;6(12):844-861. doi: 10.1038/s41570-022-00438-x. Epub 2022 Nov 14. Nat Rev Chem. 2022. PMID: 37117703 Review.
-
Predictive modeling of concentration-dependent viscosity behavior of monoclonal antibody solutions using artificial neural networks.MAbs. 2023 Jan-Dec;15(1):2169440. doi: 10.1080/19420862.2023.2169440. MAbs. 2023. PMID: 36705325 Free PMC article.
-
Net charge of antibody complementarity-determining regions is a key predictor of specificity.Protein Eng Des Sel. 2018 Nov 1;31(11):409-418. doi: 10.1093/protein/gzz002. Protein Eng Des Sel. 2018. PMID: 30770934 Free PMC article.
References
-
- Johnson HR, Lenhoff AM. Characterization and suitability of therapeutic antibody dense phases for subcutaneous delivery. Mol Pharm 2013; 10:3582-91; PMID:24011376 - PubMed
-
- Narasimhan C, Mach H, Shameem M. High-dose monoclonal antibodies via the subcutaneous route: challenges and technical solutions, an industry perspective. Ther Deliv 2012; 3:889-900; PMID:22900469; http://dx.doi.org/10.4155/tde.12.68 - DOI - PubMed
-
- Galush WJ, Le LN, Moore JM. Viscosity behavior of high-concentration protein mixtures. J Pharm Sci 2012; 101:1012-20; PMID:22170353; http://dx.doi.org/10.1002/jps.23002 - DOI - PubMed
-
- Jezek J, Rides M, Derham B, Moore J, Cerasoli E, Simler R, Perez-Ramirez B. Viscosity of concentrated therapeutic protein compositions. Adv Drug Deliv Rev 2011; 63:1107-17; PMID:22014592; http://dx.doi.org/10.1016/j.addr.2011.09.008 - DOI - PubMed
-
- Liu J, Nguyen MD, Andya JD, Shire SJ. Reversible self-association increases the viscosity of a concentrated monoclonal antibody in aqueous solution. J Pharm Sci 2005; 94:1928-40; PMID:16052543; http://dx.doi.org/10.1002/jps.20347 - DOI - PubMed
Publication types
MeSH terms
Substances
LinkOut - more resources
Full Text Sources
Other Literature Sources
Miscellaneous