. 2015 Feb:26:30-43.
doi: 10.1016/j.dnarep.2014.12.001. Epub 2014 Dec 9.

Biochemical characterization of RecA variants that contribute to extreme resistance to ionizing radiation

Affiliations

Biochemical characterization of RecA variants that contribute to extreme resistance to ionizing radiation

Joseph R Piechura et al. DNA Repair (Amst). 2015 Feb.

Abstract

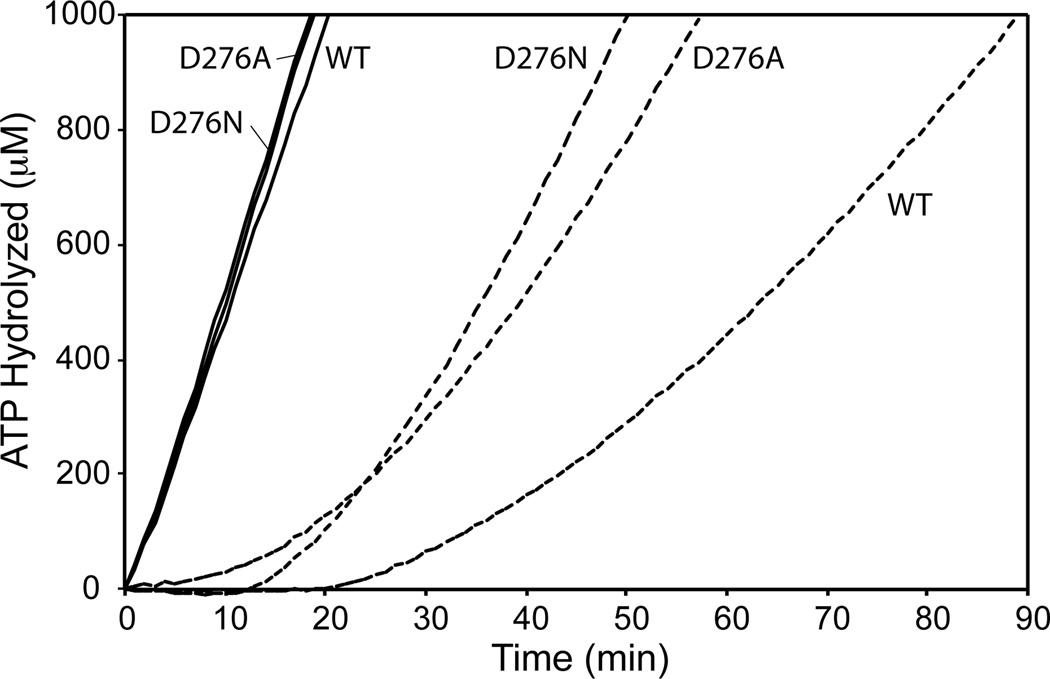
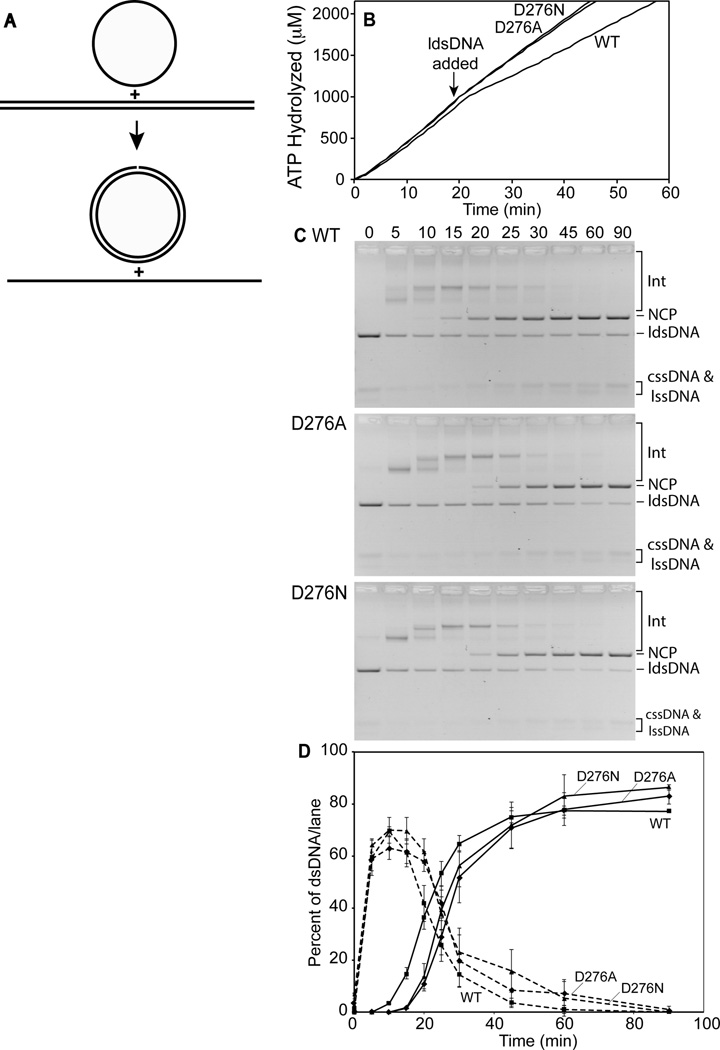
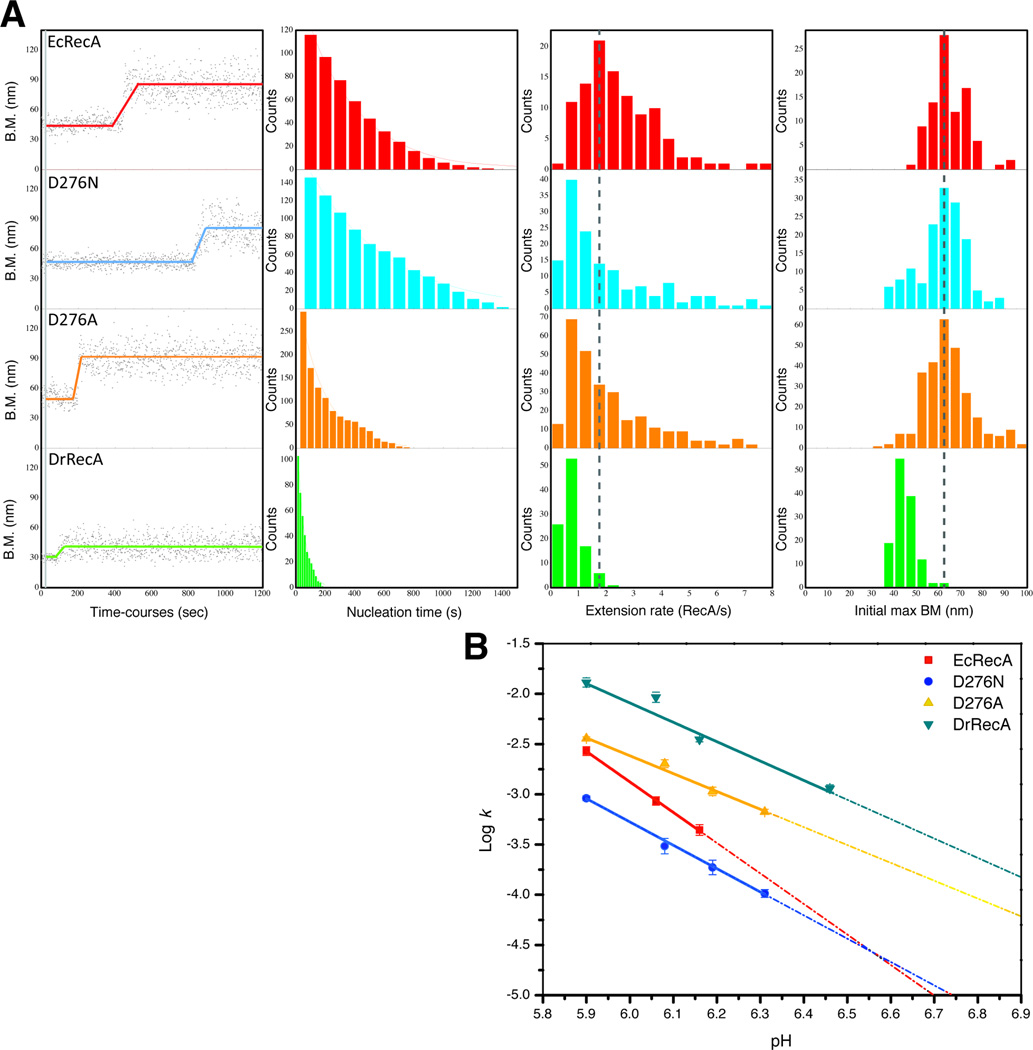
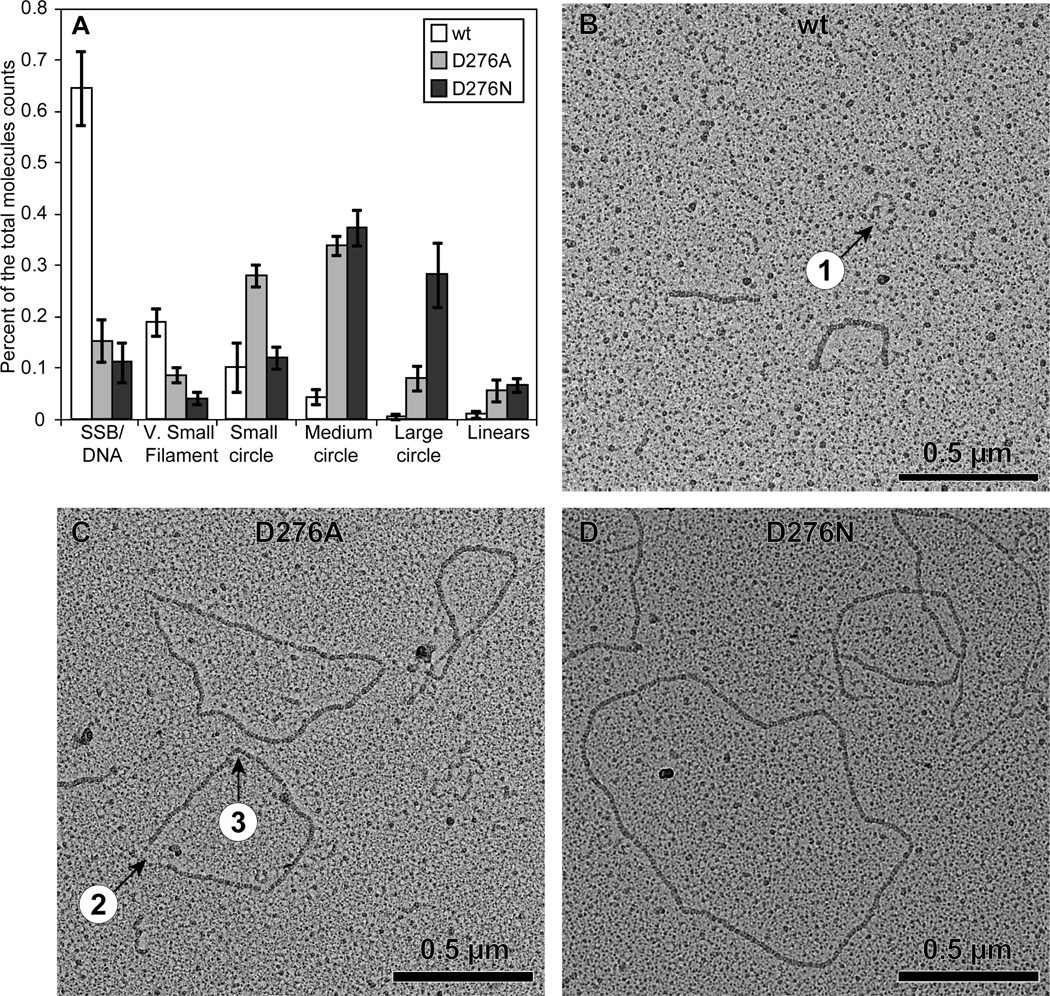
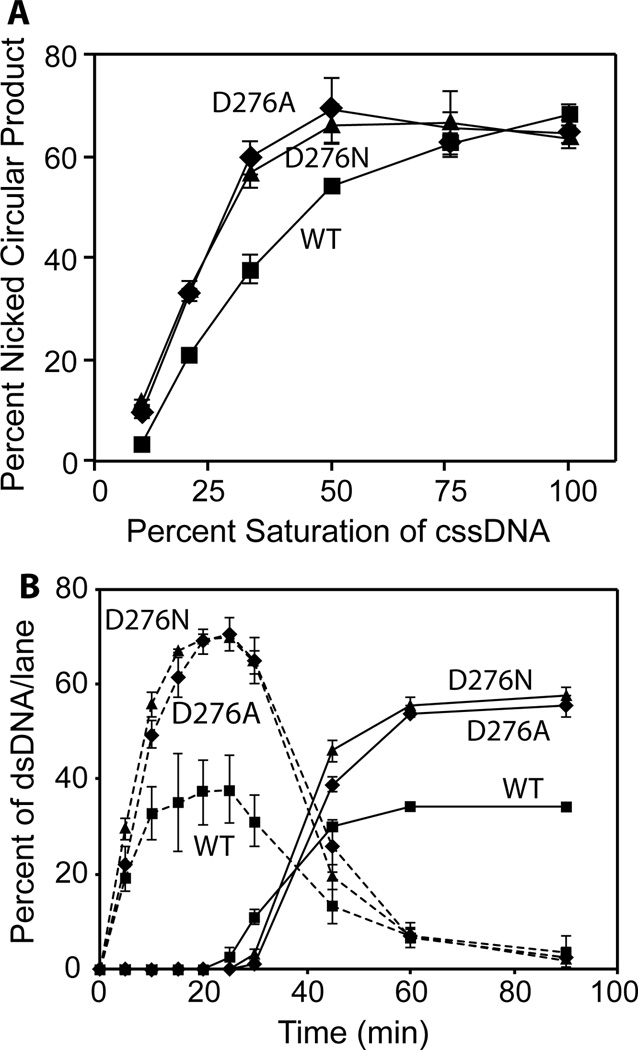
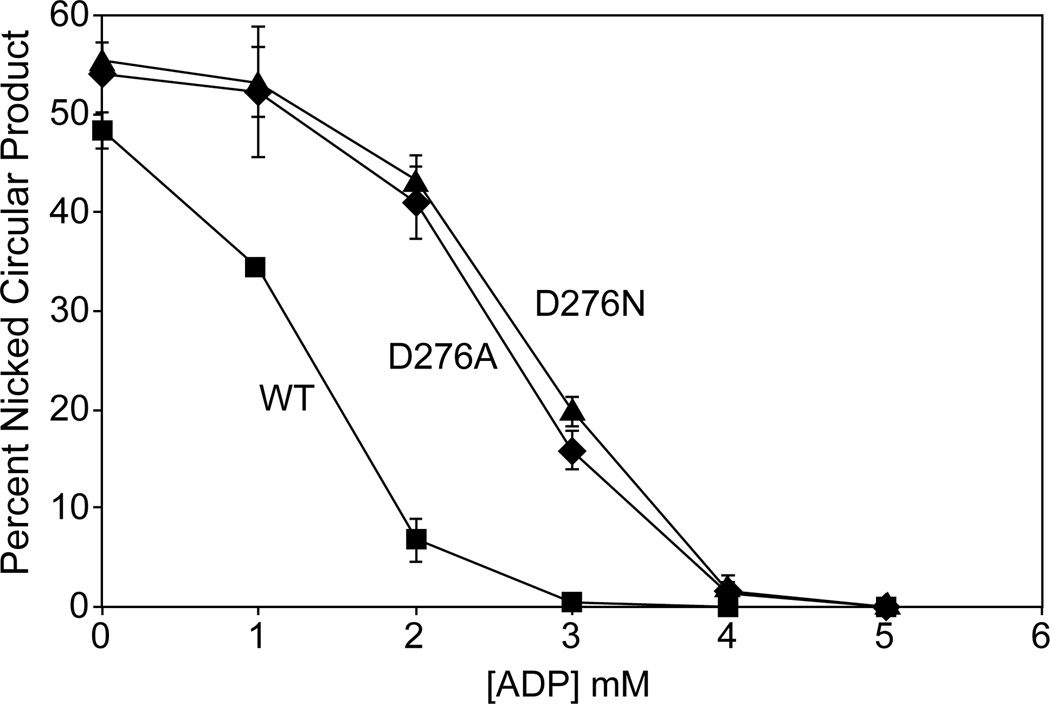
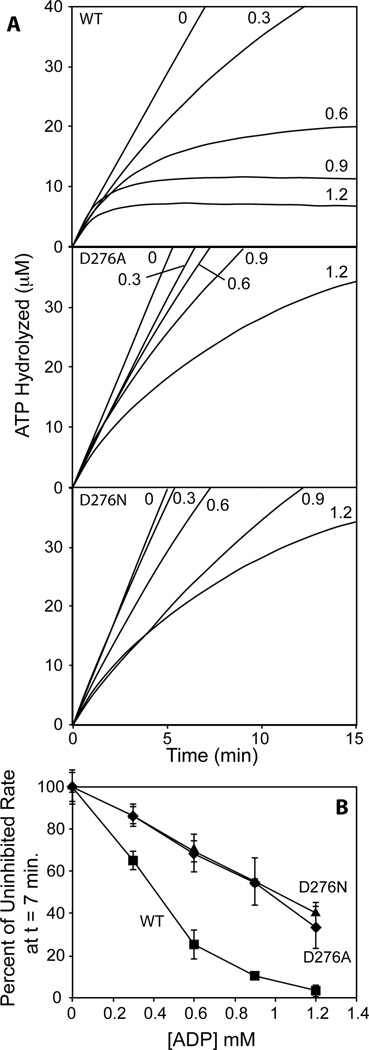
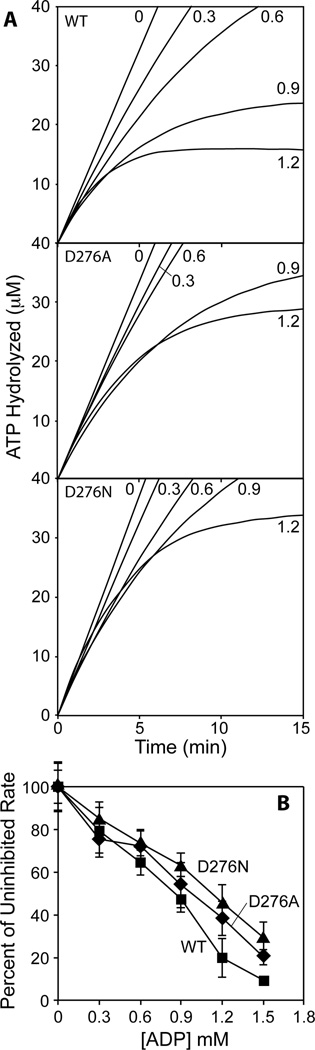
Among strains of Escherichia coli that have evolved to survive extreme exposure to ionizing radiation, mutations in the recA gene are prominent and contribute substantially to the acquired phenotype. Changes at amino acid residue 276, D276A and D276N, occur repeatedly and in separate evolved populations. RecA D276A and RecA D276N exhibit unique adaptations to an environment that can require the repair of hundreds of double strand breaks. These two RecA protein variants (a) exhibit a faster rate of filament nucleation on DNA, as well as a slower extension under at least some conditions, leading potentially to a distribution of the protein among a higher number of shorter filaments, (b) promote DNA strand exchange more efficiently in the context of a shorter filament, and (c) are markedly less inhibited by ADP. These adaptations potentially allow RecA protein to address larger numbers of double strand DNA breaks in an environment where ADP concentrations are higher due to a compromised cellular metabolism.

Keywords: DNA repair; Double strand break repair; Evolution; Radiation resistance; RecA protein.


Figures

Fig. 1
Fig. 1
RecA D276A and RecA D276N hydrolyze ATP faster when bound to circular ssDNA and more readily displace the SSB protein from circular ssDNA than Wild type RecA. The DNA-dependent RecA-catalyzed hydrolysis of ATP was monitored. Reactions were carried out as described in Experimental Procedures. Solid lines represent reactions in which RecA protein was added first to a solution containing circular ssDNA, and dashed lines represent reactions in which SSB and ATP were added first to circular ssDNA. The 0 time point corresponds to either the time of addition of ATP and SSB (solid lines) or the addition of RecA protein (dashed lines).
Fig. 2
Fig. 2
RecA D276A and RecA D276N hydrolyze ATP faster while catalyzing strand exchange but resolve strand exchange intermediates into products slower than Wild type RecA. A, The DNA strand exchange reaction promoted by RecA protein. B. ATP hydrolysis was monitored. Reactions were carried out as described in Experimental Procedures. First, 3 µM RecA protein was added to 5 µM M13mp18 circular ssDNA and incubated for 10 minutes. Then, ATP hydrolysis was initiated by the addition of 3 mM ATP and 0.5 µM SSB. Strand exchange reactions were initiated 20 min later by the addition of 10 µM homologous M13mp18 linear dsDNA (time marked with an arrow). Time 0 corresponds to the time of addition of ATP and SSB. C, Agarose gel pictures displaying the progression of the strand exchange reactions. DNA bands are labeled as seen in the reaction schematic. Time 0 corresponds to the addition of linear dsDNA to the reactions. D, The amount of nicked circular product DNA was quantified at each time point as the percentage of the total intenstity of linear dsDNA, intermediates, and product DNA in the corresponding lane. Wild type RecA reaction points are shown as squares, RecA D276A reaction points are shown as diamonds, and RecA D276N reaction points are shown as triangles. Values represent the averages of three independent experiments, with vertical error bars displaying the standard deviation of these values.
Fig. 3
Fig. 3
Single-molecule TPM observation of the nucleoprotein filament assembly process of EcRecA, D276N mutant, D276A mutant and DrRecA on dsDNA. (A). Exemplary time-courses of the filament assembly process on 382 bp dsDNA at pH 6.20. The RecA mixture was flowed in during the time represented by the short vertical gray bar at the beginning of each reacion. Before RecA forms a stable nucleus, the BM amplitude stays constant, the same as that before the gray bar. A stable nucleus is followed by a cooperative extension process, which is represented by the continuous BM increase. After the filament assembly is finished, the BM amplitude reaches a maximum plateau value. In the subsequent three columns are the accumulated histograms of observed nucleation times (the point in each trial in which BM begins to increase), observed extension rates, and observed maximum BM amplitudes. The histograms include 116, 146, 293, and 103 individual observed filaments of EcRecA, D276N, D276A and DrRecA, respectively. (B) pH-rate profiles for the measured nucleation rates for the proteins listed.
Fig. 4
Fig. 4
Early stages of filament formation by RecA wild type and variants on SSB-coated ssDNA. RecA protein filaments were spread and visualized as described in methods. A. Summary of filament categories present 5 min after RecA addition to ssDNA. Representative images are shown in panels B, C, and D. Molecule highlighted as #1 in panel B is an SSB-coated ssDNA circle. A visible gap (2) and a sharp filament bend are highlighted in panel C.
Fig. 5
Fig. 5
RecA D276A and RecA D276N more efficiently catalyze strand exchange reactions than Wild type RecA when present at sub-saturating levels of circular ssDNA. A, Strand exchange reactions were carried out as described in Experimental Procedures with RecA protein present at 10%, 20%, 33%, 50%, 75%, and 100% saturation of circular ssDNA. Reactions were deproteinized 90 minutes after the addition of linear dsDNA, resolved on an agarose gel, and the amount of circular duplex product DNA was quantified as described in Figure 2. Symbols are: ▪, wild type RecA; ♦, RecA D276A; and ▲, RecA D276N. Values of percent nicked circular product represent the averages of three independent experiments, with vertical error bars displaying the standard deviation of these values. Reactions contained varying amounts of RecA protein, 10 µM M13mp18 circular ssDNA, 20 µM M13mp18 linear dsDNA, 3 mM ATP, and 1 µM SSB. B, The amount of intermediates or product DNA at each time point from a strand exchange time course in which each RecA protein is present at 33% saturation of the circular ssDNA, quantified as described in Figure 2. Symbols are as in panel A. Points connected with a dashed line display the amount of reaction intermediates present at each time point, while points connected with a solid line display the amount of product DNA present at each time point. Values displayed represent the averages of three independent experiments, with vertical error bars displaying the standard deviation of these values.
Fig. 6
Fig. 6
The strand exchange activitity of RecA D276A and RecA D276N is less inhibited by ADP than that of Wild type RecA. Strand exchange reactions were carried out as described in Experimental Procedures, with varying concentrations of ADP. Reactions contained 5 µM M13mp18 circular ssDNA, 2 µM RecA protein (100% saturation of the available ssDNA), 5 mM ATP, and 0.5 µM SSB. To initiate strand exchange, 10 µM M13mp18 linear dsDNA was added to the reactions with 0, 1, 2, 3, 4, or 5 mM ADP. Reactions were deproteinized 60 minutes after the addition of linear dsDNA, resolved on an agarose gel, and the amount of product DNA was quantified as described in Figure 2. Values displayed on the graph are averages of data from three independent experiments, and vertical error bars represent the standard deviation of these values. Wild type RecA points are shown as squares, RecA D276A points are shown as diamonds, and RecA D276N points are shown as triangles.
Fig. 7
Fig. 7
The ATPase activity of RecA D276A and RecA D276N during strand exchange is less inhibited by ADP than that of Wild type RecA. A, Reactions were carried out as described in Experimental Procedures, and ATP hydrolysis was monitored. First, 0.6 µM RecA protein was allowed to hydrolyze ATP in the presence of 1 µM M13mp18 circular ssDNA, 1.5 mM ATP, and 0.1 µM SSB for five minutes, and then 2 µM homologous M13mp18 linear dsDNA and 0, 0.3, 0.6, 0.9, 1.2, or 1.5 mM ADP were added as a mixture. Graphs are labeled with the variant of RecA protein used in the reactions, and reaction lines are labeled with the concentration of ADP added. Time 0 corresponds to the addition of linear dsDNA and ADP. B, ATP hydrolysis data was fit with a polynomial curve and this fit was differentiated at time 7 minutes after the addition of linear dsDNA and ADP to determine the rate of hydrolysis of ATP at that time. Values from three independent experiments were averaged, and then expressed as the percentage of the rate at 7 minutes in the reaction in which no ADP was added. Vertical error bars display propogated standard deviation. Wild type RecA points are shown as squares, RecA D276A points are shown as diamonds, and RecA D276N points are shown as triangles
Fig. 8
Fig. 8
The ATPase activity of RecA D276A and RecA D276N on circular ssDNA is only slightly less inhibited by ADP than that of Wild type RecA. A, reactions were carried out as in Figure 6 but without homologous linear dsDNA, and ATP hydrolysis was monitored. Graphs are labeled with the variant of RecA protein used in the reactions, and reaction lines are labeled with the concentration of ADP added. Time 0 corresponds to the addition of ADP. B, The rate of ATP hydrolysis at time 7 minutes after the addition of ADP was quantified and converted to percentage of the rate of the reaction to which no ADP was added as described in Figure 6. Wild type RecA points are shown as squares, RecA D276A points are shown as diamonds, and RecA D276N points are shown as triangles.

Similar articles

Cited by

References

    1. Blasius M, Hubscher U, Sommer S. Deinococcus radiodurans: What belongs to the survival kit? Crit. Rev. Biochem. Mol. Biol. 2008;43:221–238. - PubMed
    1. Cox MM, Battista JR. Deinococcus radiodurans - The consummate survivor. Nature Rev. Microbiol. 2005;3:882–892. - PubMed
    1. Daly MJ. Death by protein damage in irradiated cells. DNA Repair. 2012;11:12–21. - PubMed
    1. Slade D, Radman M. Oxidative Stress Resistance in Deinococcus radiodurans . Microbiol. Mol. Biol. Rev. 2011;75:133–191. - PMC - PubMed
    1. Battista JR. Against all odds - the survival strategies of Deinococcus radiodurans. Annu. Rev. Microbiol. 1997;51:203–224. - PubMed

Publication types

MeSH terms