. 2015 Jan 6:5:7633.
doi: 10.1038/srep07633.

Thyrotropin and obesity: increased adipose triglyceride content through glycerol-3-phosphate acyltransferase 3

Affiliations

Thyrotropin and obesity: increased adipose triglyceride content through glycerol-3-phosphate acyltransferase 3

Shizhan Ma et al. Sci Rep. .

Abstract

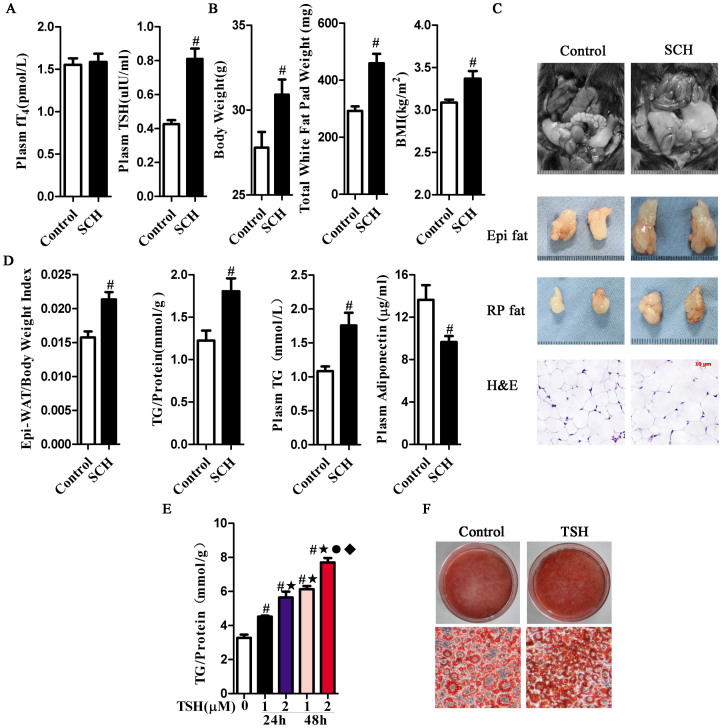
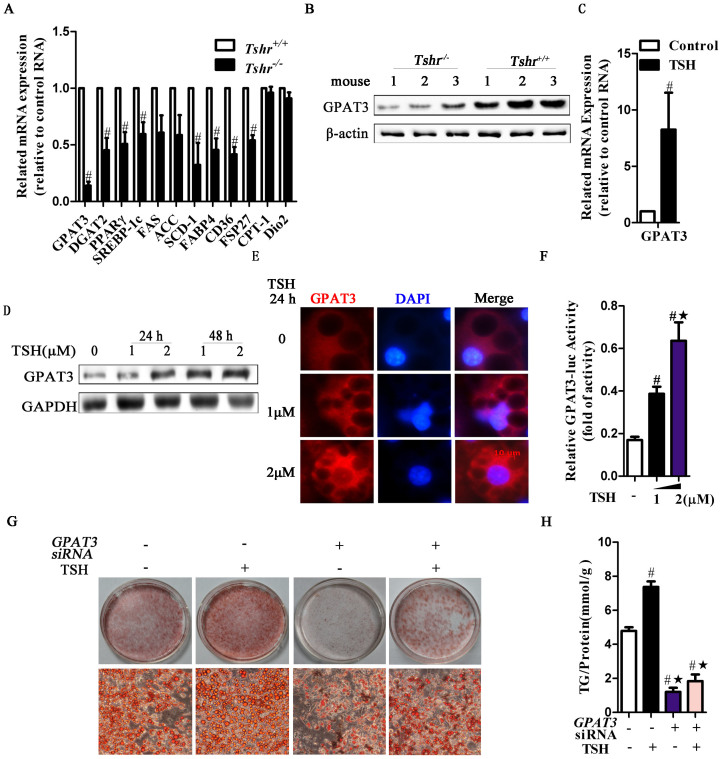
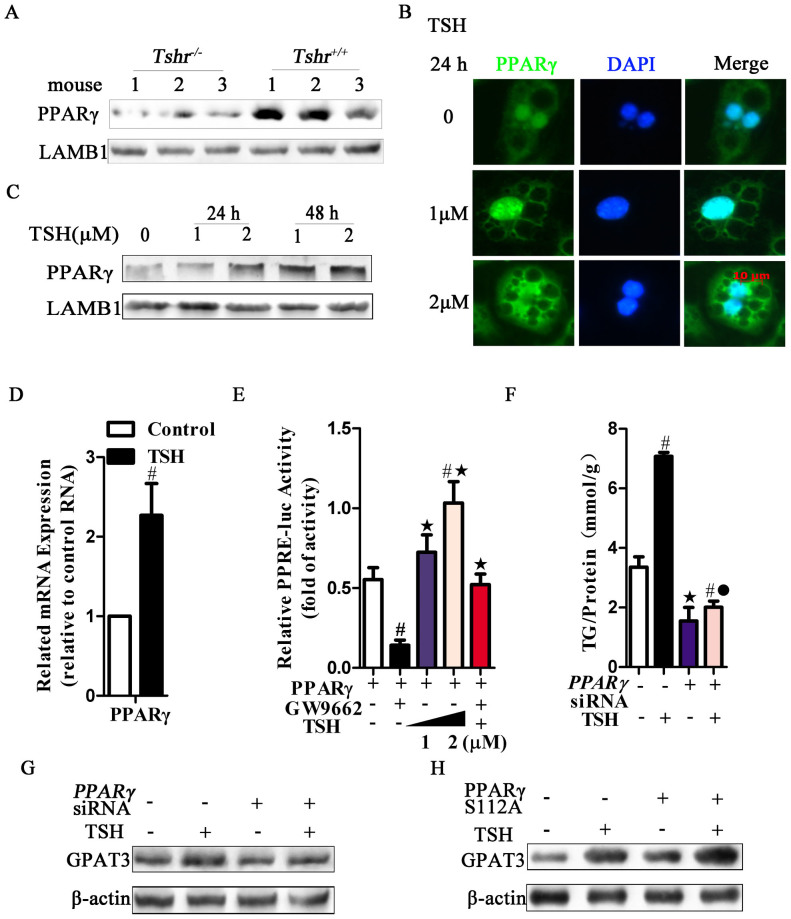
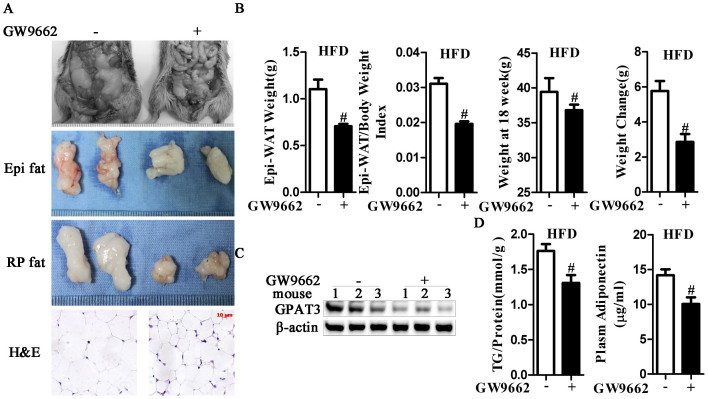
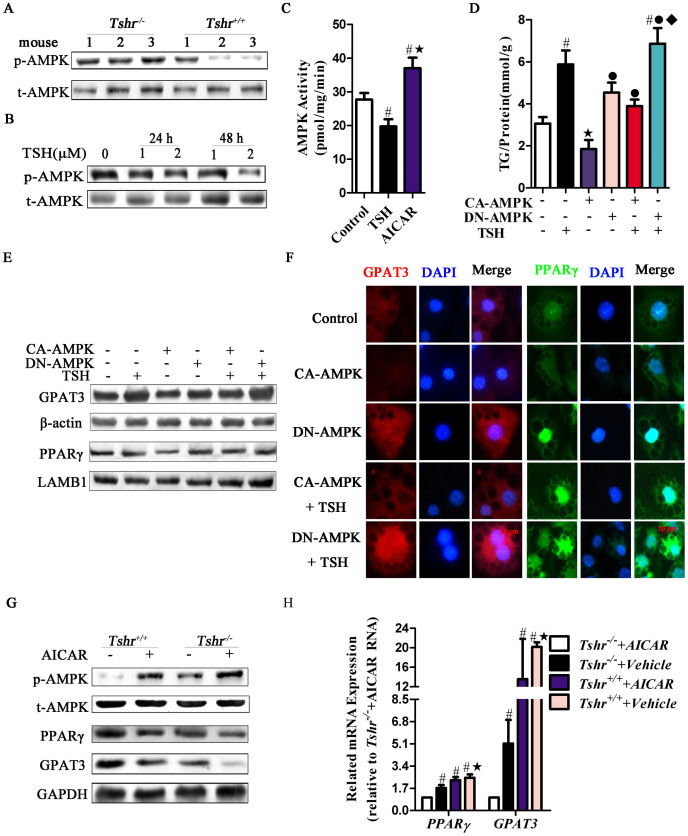
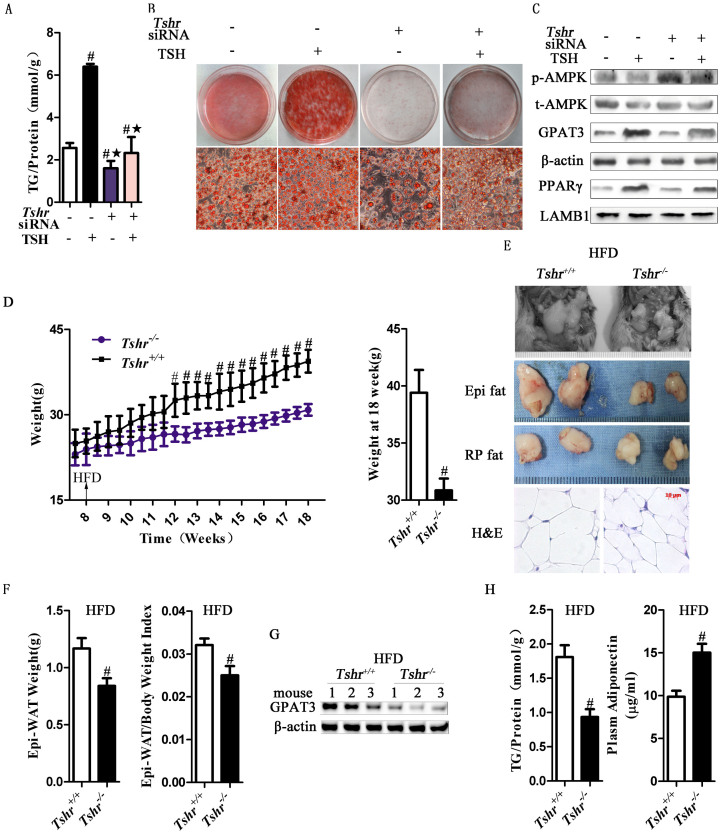
Epidemiological evidence indicates that thyrotropin (TSH) is positively correlated with the severity of obesity. However, the mechanism remains unclear. Here, we show that TSH promoted triglyceride (TG) synthesis in differentiated adipocytes in a thyroid hormone-independent manner. Mice with subclinical hypothyroidism, which is characterized by elevated serum TSH but not thyroid hormone levels, demonstrated a 35% increase in the total white adipose mass compared with their wild-type littermates. Interestingly, Tshr KO mice, which had normal thyroid hormone levels after thyroid hormone supplementation, resisted high-fat diet-induced obesity. TSH could directly induce the activity of glycerol-3-phosphate-acyltransferase 3 (GPAT3), the rate-limiting enzyme in TG synthesis, in differentiated 3T3-L1 adipocytes. However, following either the knockdown of Tshr and PPARγ or the constitutive activation of AMPK, the changes to TSH-triggered GPAT3 activity and adipogenesis disappeared. The over-expression of PPARγ or the expression of an AMPK dominant negative mutant reversed the TSH-induced changes. Thus, TSH acted as a previously unrecognized master regulator of adipogenesis, indicating that modification of the AMPK/PPARγ/GPAT3 axis via the TSH receptor might serve as a potential therapeutic target for obesity.


Figures

Figure 1
Figure 1. TSH-stimulated mature adipocyte TG synthesis.
Male C57/BL6 mice were given methimazole (MMI, 0.04 mg/kg BW·d, SCH group, n = 8) or a corresponding volume of vehicle (control group, n = 8) for 12 weeks. (A) The plasma fT4 and TSH levels were assayed, respectively. (B) The body weight, total fat pad weight and BMI levels were assayed, respectively.(C) Representative images and H&E staining of total white adipose tissue (Epi-WAT). (D) Effect of TSH on white adipose tissue metabolism. Epi-WAT index, Epi-WAT triglyceride (TG) contents, plasma levels of TG and adiponectin were measured, respectively. (E) Intracellular TG contents were determined with the indicated concentrations of TSH for indicated time in differentiated 3T3-L1 cells, and were normalized by the total proteins in same a sample. The results are expressed as the mean ± SD. #p < 0.05 compared with control; p < 0.05 compared with 1 μM TSH at 24 h; ˙p < 0.05 compared with 2 μM TSH at 24 h; p < 0.05 compared with 1 μM TSH at 48 h. (F) Oil red O staining differentiated 3T3-L1 cells treated with 2 μM TSH for 48 h.
Figure 2
Figure 2. TSH promotes adipocyte GPAT3 activity, leading to elevated TG synthesis.
Homozygous Tshr-knockout mice (Tshr−/−) were supplemented with T4 (serum T4 levles were similar to that in the wild type mice, p > 0.05) to avoid the effects of the thyroid hormones. Tshr+/+ mice were used as controls. (A) RT-PCR analysis of adipogenesis-related gene expression in the Epi-WAT. #p < 0.05 compared with Tshr+/+ mice. (B) The expression of GPAT3 protein was detected by western blot. (C) RT-PCR analysis of GPAT3 mRNA in TSH (2 μM, for 48 h)-treated differentiated 3T3-L1 cells. #p < 0.05 compared with control. (D) The time-dependent and does-dependent effects of TSH on GPAT3 expression in differentiated 3T3-L1 cells. (E) Immunofluorescence staining of GPAT3 in differentiated 3T3-L1 cells treated with the indicated concentrations of TSH for 24 h. The blue color depicts the DAPI-stained nuclei, and the red shows the GPAT3 protein (TRITC-conjugated). (F) HEK293 cells were transfected with GPAT3 luciferase reporter construct vectors for 48 h, then treated with vehicle or TSH (1 or 2 μM) for an additional 24 h. GPAT3 activity was detected by dual luciferase reporters. #p < 0.05 compared with control; p < 0.05 compared with 1 μM TSH at 24 h. (G–H) RNAi of GPAT3 inhibited TSH-induced TG synthesis. After transfection with non-targeting or GPAT3 siRNA for 48 h, the differentiated 3T3-L1 cells were incubated with TSH (2 μM) or vehicle for another 24 h. (G) Lipid droplet contents and (H) intracellular TG contents were assayed. The results are expressed as the mean ± SD. #p < 0.05 compared with the non-targeting siRNA group; p < 0.05 compared with TSH group. All panels above are representative of 3 independent experiments. All the gels were run under the same experimental conditions, and key data cropped blots are used here. The full-length gel images are available in Supplementary Fig. 6.
Figure 3
Figure 3. PPARγ is an essential requirement for the regulation of TSH-induced adipogenesis.
(A) PPARγ nuclear proteins were detected by western blot in the Epi-WAT of Tshr−/− and Tshr+/+ mice, respectively. (B) Immunofluorescence staining of PPARγ in differentiated 3T3-L1 cells treated with the indicated concentrations of TSH for 24 h. The blue color depicts the DAPI-stained nuclei, and the green shows the PPARγ protein (FITC conjugated). (C) The time-dependent and does-dependent effects of TSH on PPARγ expression in differentiated 3T3-L1 cells. (D) RT-PCR analysis of PPARγ mRNA in TSH (2 μM, for 48 h)-treated differentiated 3T3-L1 cells. #p < 0.05 compared with control. (E) HEK293 cells were transfected with PPRE-luciferase reporter constructs, along with PPARγ expression vectors. Cells were treated with the vehicle, GW9662 (20 μM), or TSH (1 or 2 μM) for an additional 24 h. PPARγ activity was detected by dual luciferase reporters. #p < 0.05 compared with PPARγ plasmid group, p < 0.05 compared with PPARγ plasmid + GW9662 group. (F–G) Differentiation 3T3-L1 cells were infected with the PPARγ siRNA or non-targeting siRNA to silence PPARγ expression. After transfection with non-targeting or PPARγ siRNA for 48 h, differentiated 3T3-L1 cells were incubated with TSH (2 μM) or vehicle for another 24 h. (F)Intracellular TG contents were assayed, the results are expressed as the mean ± SD. #p < 0.05 compared with the non-targeting siRNA group; p < 0.05 compared with TSH group; ˙p < 0.05 compared with PPARγ siRNA group. (G) GPAT3 protein levels were analyzed using western blots. (H) After transfection with or without the PPARγ S112A plasmid for 48 h, differentiated 3T3-L1 cells were incubated with TSH (2 μM) or vehicle for another 24 h. GPAT3 protein was analyzed by western blot. All of the above panels are representative of 3 independent experiments. All the gels were run under the same experimental conditions, and key data cropped blots are used here. The full-length gel images are available in Supplementary Fig. 6.
Figure 4
Figure 4. Antagonism of PPARγ prevents high-fat-diet-induced obesity in vivo.
High-fat-diet (HFD) chowed C57/BL6 mice were subjected to GW9662 at a dose of 0.35 mg/kg per day in their drinking water for 5 weeks (GW9662 group, n = 8) or to a corresponding volume of vehicle (control group, n = 8). (A) Increases in body fat were suppressed by GW9662 treatment, and the adipose mass of Epi fat, retroperitoneal fat (RP fat) and adipocyte size were diminished in the GW9662 group. (B) Epi-WAT weight, WAT index, weight at 18 weeks and weight changes were measured. #p < 0.05 compared with control group. (C) The protein expression of GPAT3 was measured using western blots. The gels were run under the same experimental conditions, and cropped blots are used here. The full-length gel images are available in Supplementary Fig. 6. (D) Intracellular TG levels and plasma adiponectin were detected, respectively. The results are expressed as the mean ± SD. #p < 0.05 compared with control group. All of the above panels are representative of 3 independent experiments.
Figure 5
Figure 5. TSH-stimulated adipogenesis was dependent on AMPK.
(A) Phosphorylated protein at Thr172 of AMPKα subtype (p-AMPK) was detected by western blot in the Epi-WAT of Tshr−/− and Tshr+/+ mice. (B) The time-dependent and dose-dependent effects of TSH on p-AMPK protein expression in differentiated 3T3-L1 cells. (C) After cells were incubated with TSH (1 μM), AICAR (1 mM) or vehicle for 24 h, the differentiated 3T3-L1 cells underwent AMPK activity assays with SAMS peptides. #p < 0.05 compared with control; p < 0.05 compared with TSH group. (D–F) Differentiated 3T3-L1 cells were transfected with constitutively activated AMPK (CA-AMPK) or dominant negative mutant of AMPK (DN-AMPK) plasmids for 48 h and then stimulated with or without 1 μM TSH for another 24 h. (D) Intracellular TG contents were detected. #p < 0.05 compared with control; p < 0.05 compared with TSH group; ˙p < 0.05 compared with CA-AMPK group; p < 0.05 compared with CA-AMPK + TSH group. GPAT3 and PPARγ expression and location were detected by (E) western blotting or (F) immunofluorescent staining, respectively. (G–H) Tshr+/+ or Tshr−/− mice were injected intraperitoneally with AICAR (n = 5, respectviely) or PBS (n = 5, respectviely) for 3 weeks. (G) The p-AMPK, total AMPK, GPAT3 and PPARγ protein were detected by western blot. (H) GPAT3 and PPARγ mRNA levels were detected by RT- PCR. #p < 0.05 compared with Tshr−/− + AICAR group; p < 0.05 compared with Tshr−/− + Vehicle group. All of the panels above are representative of 3 independent experiments. All the gels were run under the same experimental conditions, and key data cropped blots are used here. The full-length gel images are available in Supplementary Fig. 6.
Figure 6
Figure 6. The effects of TSH on adipogenesis were reversed when the expression of Tshr was silenced in vivo and in vitro.
(A–C) Differentiated 3T3-L1 cells were transfected with non-targeting or Tshr siRNA. After 48 h, the cells were incubated with or without TSH (2 μM), for 24 h. (A) TG contents and (B) lipid contents were measured, respectively. #p < 0.05 compared with non-targeting siRNA group; p < 0.05 compared with TSH group. (C) The p-AMPK, total AMPK, GPAT3 and PPARγ protein expression were analyzed by western blot. (D–H) Tshr−/− (n = 8) and Tshr+/+ (n = 8) mice were fed a high-fat diet for 10 weeks. (D) Weight gain was decreased in Tshr−/− mice. Body weight was monitored twice a week. (E) Adipose mass of Epi fat, RP fat and the size of the adipocytes were diminished in the Tshr−/− group. (F) Epi-WAT weight and the WAT index were assayed. #p < 0.05 compared with the Tshr+/+ group. (G) The protein expression levels of GPAT3 were detected by western blot. (H) Intracellular TG levels and plasma adiponectin were detected. The results are expressed as the mean ± SD. #p < 0.05 compared with Tshr+/+ group. All of the above panels are representative of 3 independent experiments. All the gels were run under the same experimental conditions.

Similar articles

Cited by

References

    1. Hotamisligil G. S. & Erbay E. Nutrient sensing and inflammation in metabolic diseases. Nat Rev Immunol 8, 923–934 (2008). - PMC - PubMed
    1. Boucher J. et al. Impaired thermogenesis and adipose tissue development in mice with fat-specific disruption of insulin and IGF-1 signalling. Nat Commun 3, 902 (2012). - PMC - PubMed
    1. Steinberger J., Moorehead C., Katch V. & Rocchini A. P. Relationship between insulin resistance and abnormal lipid profile in obese adolescents. J Pediatr 126, 690–695 (1995). - PubMed
    1. Cawthorn W. P., Scheller E. L. & MacDougald O. A. Adipose tissue stem cells: the great WAT hope. Trends Endocrinol Metab 23, 270–277 (2012). - PMC - PubMed
    1. Russo P., Lauria F. & Siani A. Heritability of body weight: moving beyond genetics. Nutr Metab Cardiovasc Dis 20, 691–697 (2010). - PubMed

Publication types

MeSH terms