

2013 Annual Report of the American Association of Poison Control Centers' National Poison Data System (NPDS): 31st Annual Report
- PMID: 25559822
- PMCID: PMC4782684
- DOI: 10.3109/15563650.2014.987397
2013 Annual Report of the American Association of Poison Control Centers' National Poison Data System (NPDS): 31st Annual Report
Abstract
Background: This is the 31st Annual Report of the American Association of Poison Control Centers' (AAPCC) National Poison Data System (NPDS). As of January 1, 2013, 57 of the nation's poison centers (PCs) uploaded case data automatically to NPDS. The upload interval was 8.08 [7.10, 11.63] (median [25%, 75%]) minutes, creating a near real-time national exposure and information database and surveillance system.
Methodology: We analyzed the case data tabulating specific indices from NPDS. The methodology was similar to that of previous years. Where changes were introduced, the differences are identified. Poison center (PC) cases with medical outcomes of death were evaluated by a team of 38 medical and clinical toxicologist reviewers using an ordinal scale of 1-6 to assess the Relative Contribution to Fatality (RCF) of the exposure to the death.
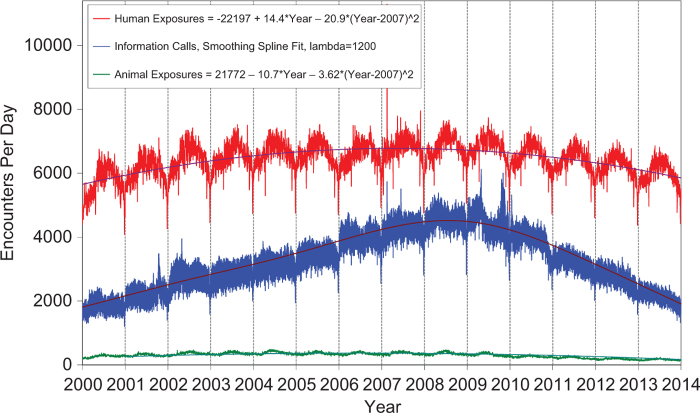
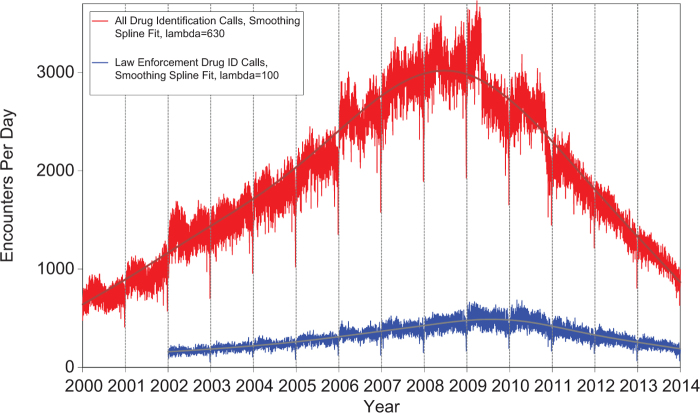
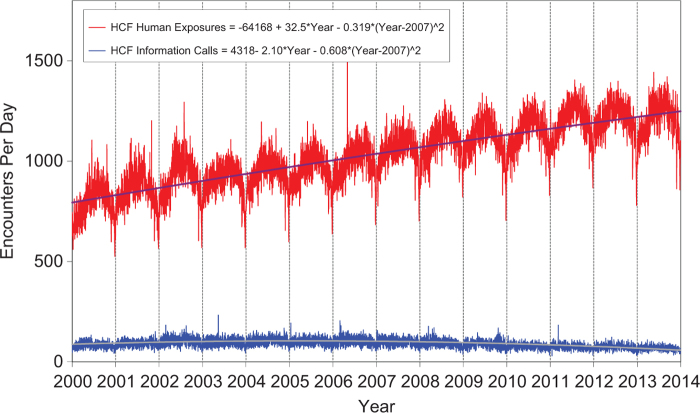
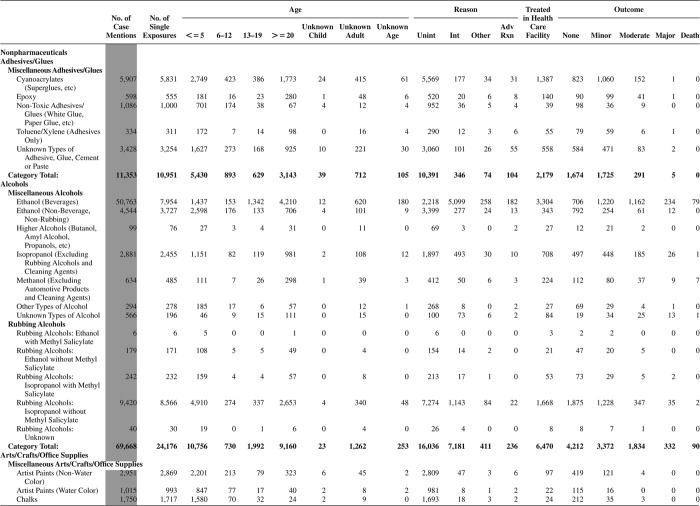
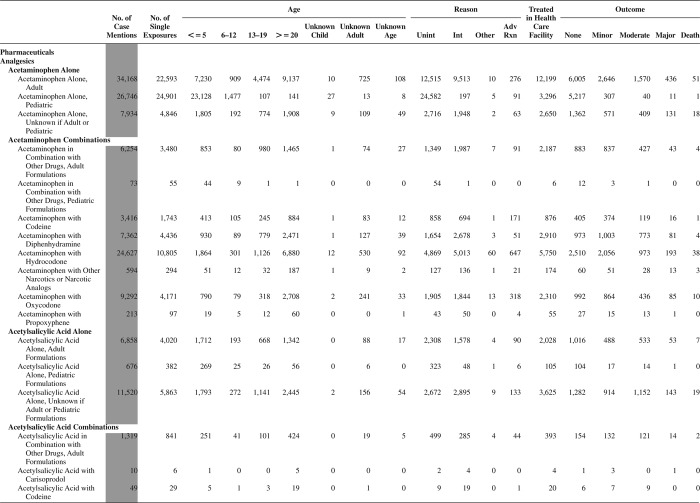
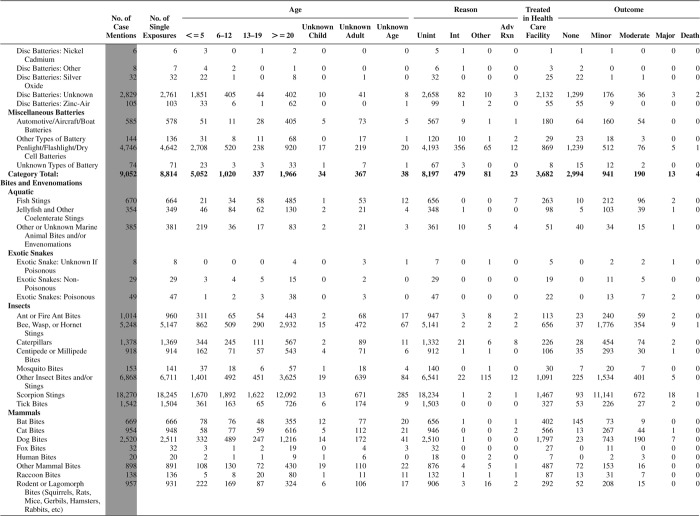
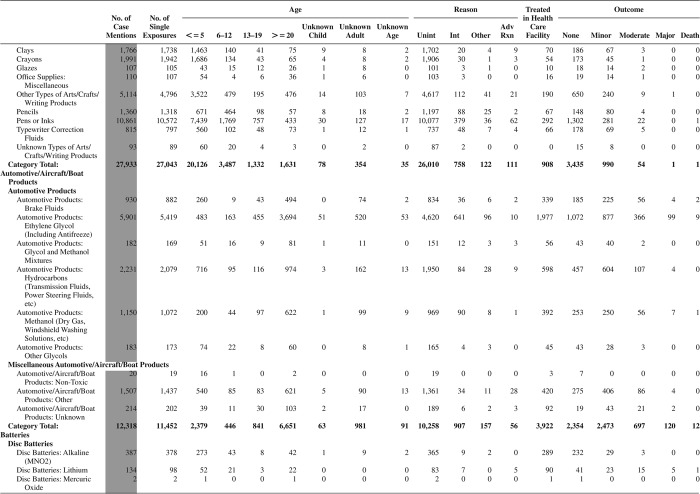
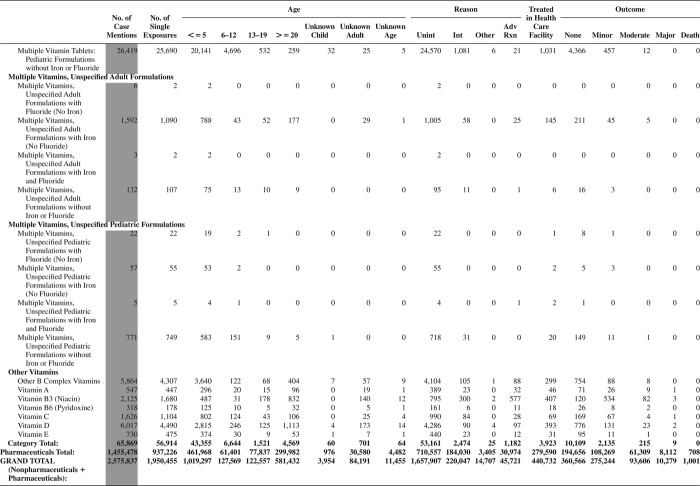
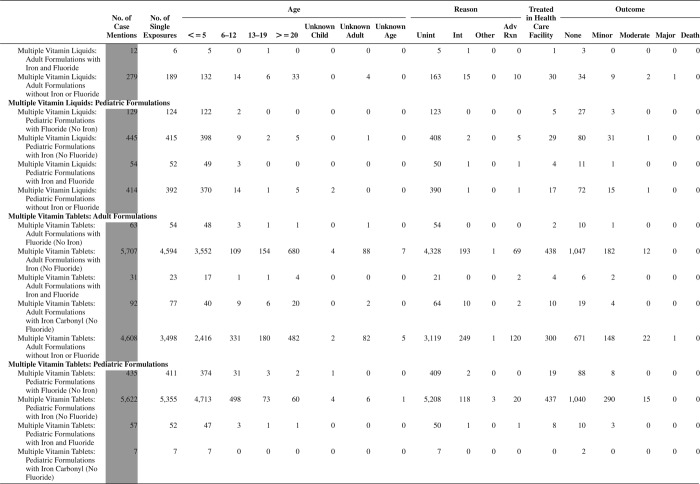
Results: In 2013, 3,060,122 closed encounters were logged by NPDS: 2,188,013 human exposures, 59,496 animal exposures, 806,347 information calls, 6,116 human-confirmed nonexposures, and 150 animal-confirmed nonexposures. Total encounters showed a 9.3% decline from 2012, while health care facility human exposure calls were essentially flat, decreasing by 0.1%.All information calls decreased 21.4% and health care facility (HCF) information calls decreased 8.5%, medication identification requests (drug ID) decreased 26.8%, and human exposures reported to US PCs decreased 3.8%. Human exposures with less serious outcomes have decreased 3.7% per year since 2008 while those with more serious outcomes (moderate, major or death) have increased by 4.7% per year since 2000. The top five substance classes most frequently involved in all human exposures were analgesics (11.5%), cosmetics/personal care products (7.7%), household cleaning substances (7.6%), sedatives/hypnotics/antipsychotics (5.9%), and antidepressants (4.2%). Sedative/hypnotics/antipsychotics exposures as a class increased most rapidly (2,559 calls/year) over the last 13 years for cases showing more serious outcomes. The top five most common exposures in children of 5 years or less were cosmetics/personal care products (13.8%), household cleaning substances (10.4%), analgesics (9.8%), foreign bodies/toys/miscellaneous (6.9%), and topical preparations (6.1%). Drug identification requests comprised 50.7% of all information calls. NPDS documented 2,477 human exposures resulting in death with 2,113 human fatalities judged related (RCF of 1, undoubtedly responsible; 2, probably responsible; or 3, contributory).
Conclusions: These data support the continued value of PC expertise and need for specialized medical toxicology information to manage the more severe exposures, despite a decrease in calls involving less severe exposures. Unintentional and intentional exposures continue to be a significant cause of morbidity and mortality in the United States. The near real-time, always current status of NPDS represents a national public health resource to collect and monitor US exposure cases and information calls. The continuing mission of NPDS is to provide a nationwide infrastructure for public health surveillance for all types of exposures, public health event identification, resilience response and situational awareness tracking. NPDS is a model system for the nation and global public health.
Figures
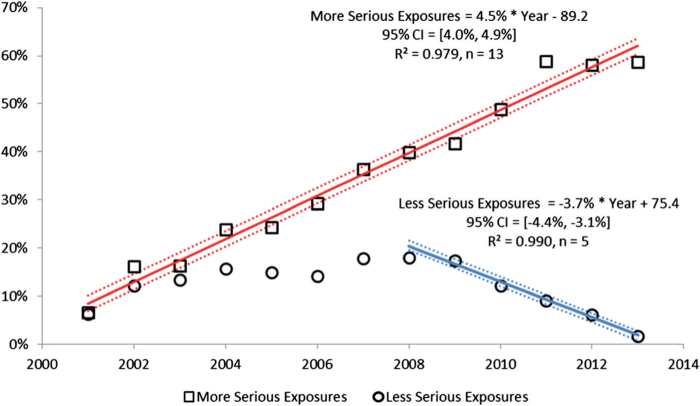
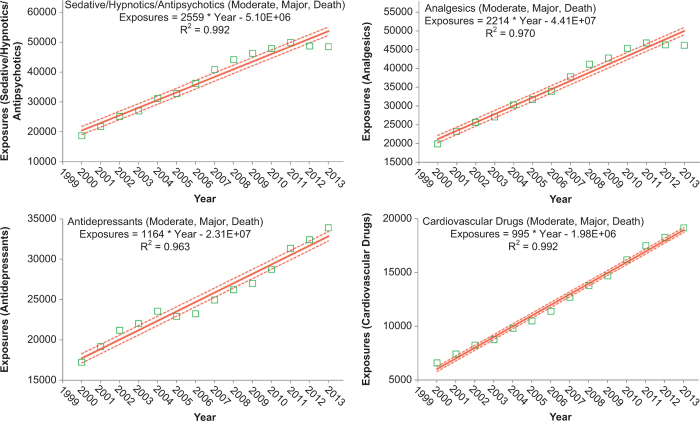
 ). Broken lines show 95% confidence interval on the regression. More Serious Exposures include Medical Outcome of Moderate, Major and Death (colour version of this figure can be found in the online version at
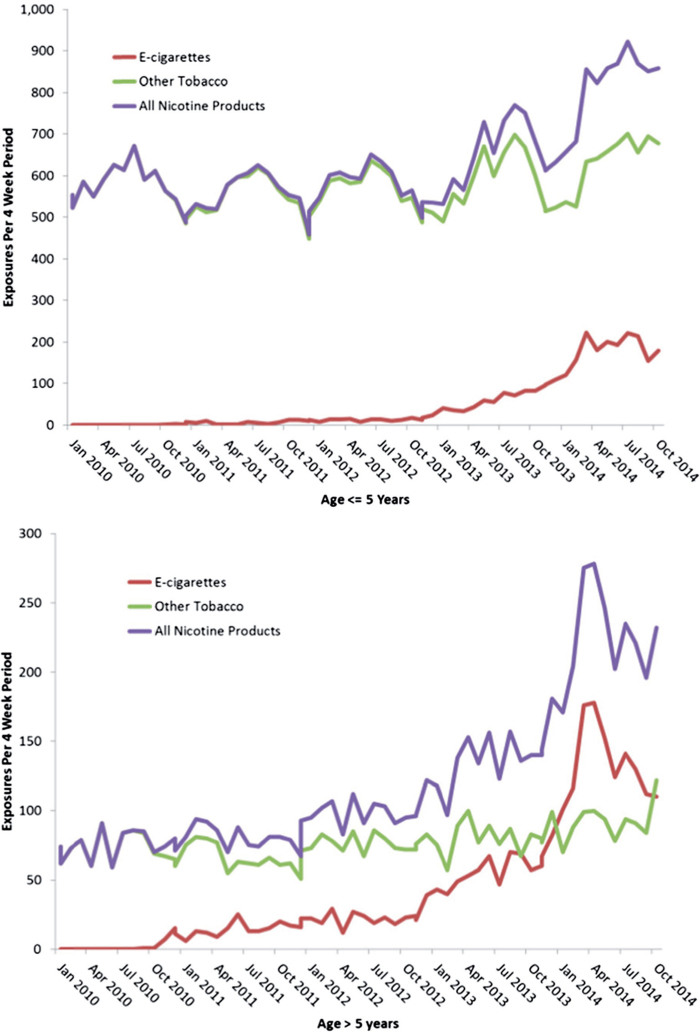
 E-cigarette), traditional tobacco products such as cigarettes, snuff, and chewing tobacco (
 Other Tobacco) and the sum of the two groups (
 All Nicotine Products) since January 2010. Pharmaceutical nicotine products are excluded (colour version of this figure can be found in the online version at
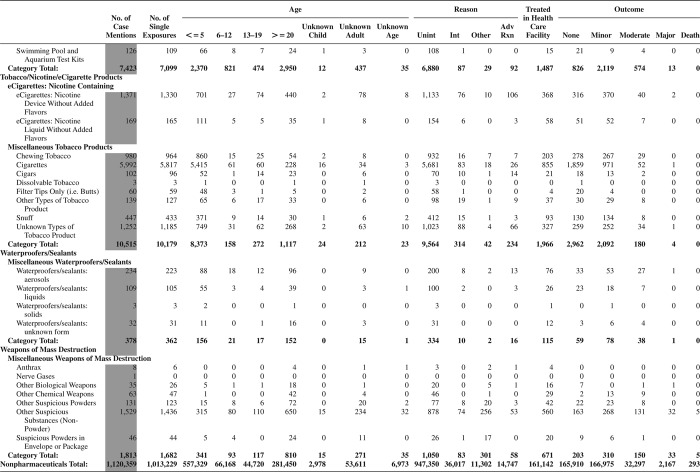


References
-
- National Poison Data System: Annual reports 1983-2012[Internet] Alexandria (VA): American Association of Poison Control Centers; http://www.aapcc.org/annual-reports/ Available from.
-
- US Census Bureau http://www.census.gov/popest/data/state/totals/2012/index.html Table 1.Annual Estimates of the Resident Population for the United States, Regions, States, and Puerto Rico: April 1, 2010 to July 1, 2012 (NST-EST2012-01)[downloaded 2013 Oct 23]
-
- http://www.census.gov/population/international/data/idb/region.php US Census Bureau: International Data Base (IDB) Demographic Indicators for: American Samoa, Federated States of Micronesia, Guam, Virgin Islands, [downloaded 2012 Oct 26]
-
- http://www.census.gov/popest/data/state/asrh/2012/SC-EST2012-AGESEX-CIV.... US Census Bureau: State Characteristics Datasets: Annual Estimates of the Civilian Population by Single Year of Age and Sex for the United States and States: April 1, 2010 to July 1, 2012[downloaded 2013Oct 23]
-
- http://www.census.gov/popest/data/puerto_rico/asrh/2013/index.html US Census Bureau Population Estimates Downloadable Datasets: Annual Estimates of the Resident Population by Single Year of Age and Sex for the United States, States, and Puerto Rico Commonwealth: April 1, 2010 to July 1, 2013, Data [downloaded 2014 Nov 4]
MeSH terms
Substances
LinkOut - more resources
Full Text Sources
Other Literature Sources
Medical