. 2015 Jun;172(11):2782-98.
doi: 10.1111/bph.13058. Epub 2015 Feb 27.

Sodium butyrate epigenetically modulates high-fat diet-induced skeletal muscle mitochondrial adaptation, obesity and insulin resistance through nucleosome positioning

Affiliations

Sodium butyrate epigenetically modulates high-fat diet-induced skeletal muscle mitochondrial adaptation, obesity and insulin resistance through nucleosome positioning

Tara M Henagan et al. Br J Pharmacol. 2015 Jun.

Abstract

Background and purpose: Sodium butyrate (NaB), an epigenetic modifier, is effective in promoting insulin sensitivity. The specific genomic loci and mechanisms underlying epigenetically induced obesity and insulin resistance and the targets of NaB are not fully understood.

Experimental approach: The anti-diabetic and anti-obesity effects of NaB treatment were measured by comparing phenotypes and physiologies of C57BL/6J mice fed a low-fat diet (LF), high-fat diet (HF) or high-fat diet plus NaB (HF + NaB) for 10 weeks. We determined a possible mechanism of NaB action through induction of beneficial skeletal muscle mitochondrial adaptations and applied microccocal nuclease digestion with sequencing (MNase-seq) to assess whole genome differences in nucleosome occupancy or positioning and to identify associated epigenetic targets of NaB.

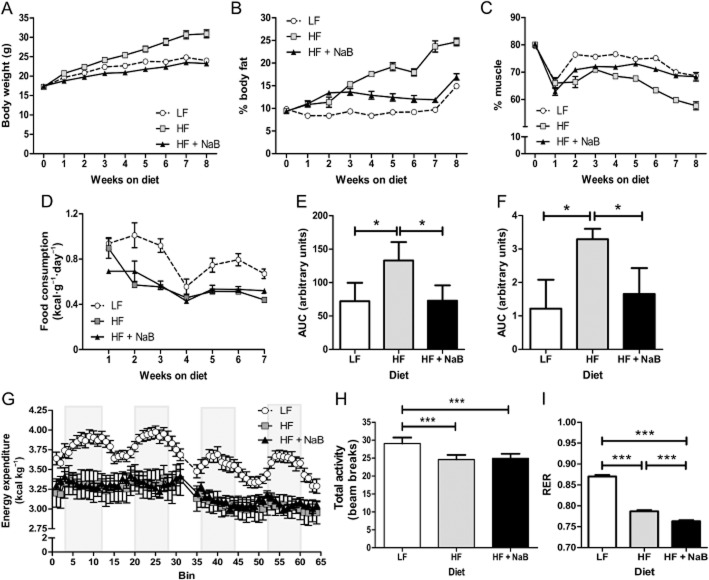
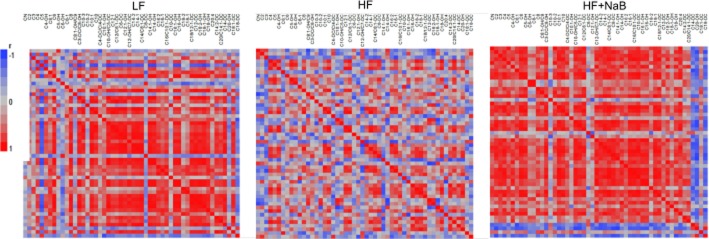
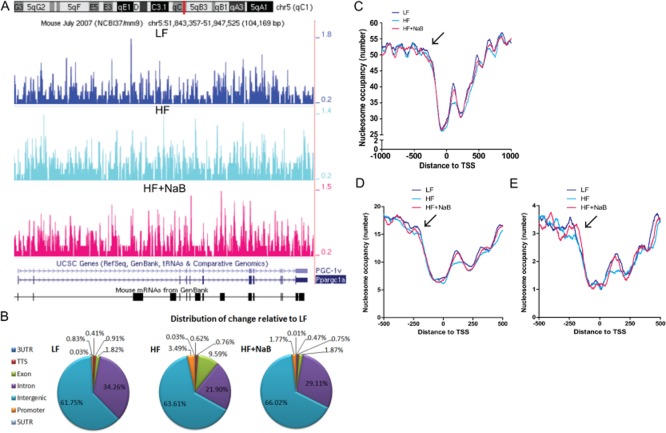
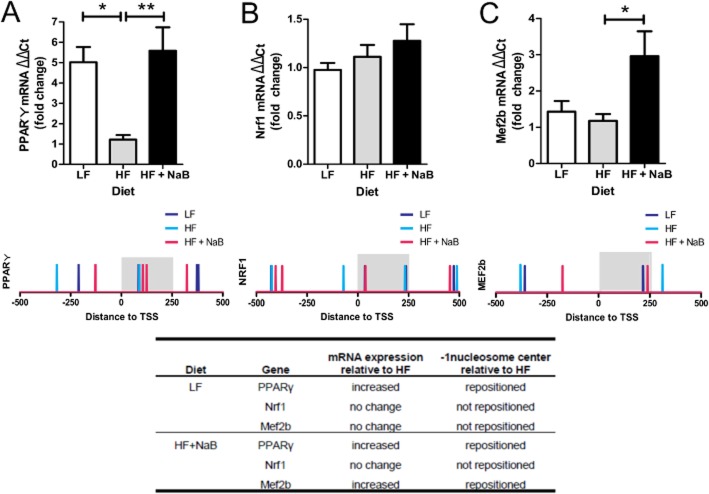
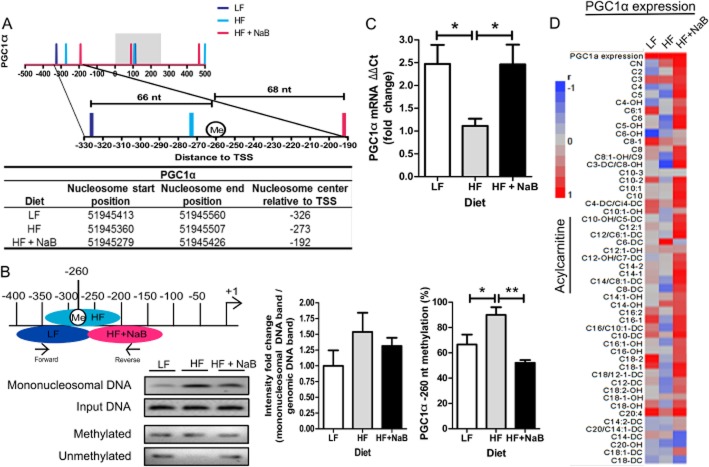
Key results: NaB prevented HF diet-induced increases in body weight and adiposity without altering food intake or energy expenditure, improved insulin sensitivity as measured by glucose and insulin tolerance tests, and decreased respiratory exchange ratio. In skeletal muscle, NaB increased the percentage of type 1 fibres, improved acylcarnitine profiles as measured by metabolomics and produced a chromatin structure, determined by MNase-seq, similar to that seen in LF. Targeted analysis of representative nuclear-encoded mitochondrial genes showed specific repositioning of the -1 nucleosome in association with altered gene expression.

Conclusions and implications: NaB treatment may be an effective pharmacological approach for type 2 diabetes and obesity by inducing -1 nucleosome repositioning within nuclear-encoded mitochondrial genes, causing skeletal muscle mitochondrial adaptations that result in more complete β-oxidation and a lean, insulin sensitive phenotype.


Figures

Figure 1
Figure 1
Whole body phenotype. C57BL/6J mice were fed LFD (LF; 10% kcal from fat), HFD (HF; 45% kcal from fat) or HF + NaB (NaB; 45% kcal from fat) diet, and body weight (A) and composition, reported as (B) percent body fat (weight of fat /body weight x100) and (C) percent muscle mass (weight of muscle/ body weight x 100), were measured weekly in the three experimental groups. (D) Food intake (consumption) was monitored weekly. Glucose tolerance (GTT) (E) and insulin tolerance (ITT) (F) tests (n = 4–5 per group) were performed after 8 weeks of feeding, and data are presented as AUC. LF, HF and HF + NaB mice were placed in metabolic chambers at 8–9 weeks of feeding their respective diets. (G) Energy expenditure was measured after a 48 h acclimation period to the chambers for a period of 4 days. Grey bars depict night periods and open areas day periods. Energy expenditure was significantly lower by repeated measures anova in HF and HF + NaB compared with LF but not different between HF and HF + NaB. Total activity (H) and RER (I) were determined during the same period and are presented as the means ± SEM over the 4 day period. *P < 0.05, ***P < 0.001; significant difference between groups; one-way anova and Tukey's test.
Figure 2
Figure 2
Correlation matrices of acylcarnitine pairwise comparisons. Pairwise comparisons correlation matrices were generated from acylcarnitine profiles of LF, HF and HF + NaB. Positive (red) and negative (blue) correlations between acylcarnitines or acylcarnitine ratios are shown within each group in heat maps.
Figure 3
Figure 3
Whole genome NMs in skeletal muscle. (A) Whole genome NMs were generated using MNase-seq in the skeletal muscle from C57BL/6J mice fed a LFD (LF), HFD (HF) or HFD plus NaB (HF + NaB), and a representative region in chromosome 5 of the mm9 genome, including the region around the TSS of Pgc1α or Pparg1cα, is shown. Additional regions of interest can be viewed at http://www.purdue.edu/hhs/nutr/labs/henagan/nucleosomemaps/. (B) Nucleosome number from genomics regions was determined using HOMER (Heinz et al., 2010). The percentage of nucleosomes within each genomic region in LF is presented. HF and HF + NaB regional number was compared to LF, and the distribution of differences for each is presented as regional changes in comparison to LF. (C) Distribution of nucleosomes across a gene fragment surrounding the transcription start site (TSS) from nucleotide −1000 to nucleotide +1000 relative to TSS in genes of the whole genome in skeletal muscle samples is shown as a smoothed graph for LF, HF and HF + NaB groups. The number of nucleosomes around the TSS from nucleotide −500 to nucleotide +500 within genes specific to differentially enriched metabolic GO terms (D) (see Table 2 for a list of these terms) or within known nuclear-encoded mitochondrial genes (E) [see Supporting Information Table S4 for a complete list of MitoCarta genes (Pagliarini et al., 2008)] in skeletal muscle from LF, HF and HF + NaB mice are shown as smoothed graphs. Note: the arrow in (C), (D) and (E) denotes the first peak in nucleosome occupancy upstream of the nucleosome-free region before the TSS.
Figure 4
Figure 4
Nucleosome positioning in nuclear-encoded mitochondrial genes. Expression of (A) peroxisome proliferator-activated receptor gamma (Pparγ), (B) nuclear respiratory factor 1 (Nrf1) and (C) myocyte enhancer factor 2b (Mef2b) in skeletal muscle from LF, HF and HF + NaB mice was quantified by qRT-PCR and expressed as fold change using the ΔΔCt method. *P < 0.05, significant difference between groups; one-way anova and Tukey's test. Below each graph, nucleosome positions are depicted within −500 to +500 of the transcription start site (TSS) for Pparγ, Nrf1 and Mef2b. Each bar represents the nucleosome centre in LF, HF and HF + NaB mice. A summary of changes in gene expression and the −1 nucleosome centre position in LF and HF + NaB in comparison to HF is shown for each gene in the inset table.
Figure 5
Figure 5
Pgc1α nucleosome positioning, gene expression and correlation with acylcarnitines. (A) Distribution of nucleosome centres within a region surrounding the transcription start site (TSS, −500 to +500 nucleotides) in the Pgc1α in skeletal muscle from LF HFand HF + NaB groups. The grey region represents the 0 to +250 region where HF shows the largest decrease in the number of nucleosomes compared with LF and HF + NaB (see Figure 4B, D and E). The region of the −1 nucleosome within the Pgc1α is magnified with the regulatory methylation site at −260 nucleotide marked as Me. The table below shows the range of nucleosomal DNA within chromosome 5, where Pgc1α is encoded, for −1 nucleosome in each dietary group. (B) −1 nucleosome position in Pgc1α in each treatment group is shown in relation to qPCR primers (ecliptic circles). −1 nucleosome position was determined in individual skeletal muscle samples (n = 5) from each treatment group by qPCR and a representative gel image is shown for mononucleosomal and genomic input DNA. DNA methylation was determined by MSP in individual skeletal muscle samples (n = 5) from each treatment group and a representative gel image is shown for products of the primer pair specific to methylation at the −260 nucleotide and unmethylated gDNA at the −260 nucleotide. For both qPCR and MSP, densitometry was performed for each individual sample and the average values were graphed for LF (white), HF (grey) and HF + NaB (black). (C) Pgc1α gene expression in LF (white), HF (grey) and HF + NaB (black) was quantified in skeletal muscle by qRT-PCR using the ΔΔCt method and is expressed as fold change relative to HF. (D) Pairwise correlation matrices for PgcC1α expression and acylcarnitines are shown to the right. Red represents a positive correlation and blue a negative correlation. Asterisk (*) denotes a significant difference between groups by one-way anova and post hoc Tukey's test at P < 0.05. Double asterisk (**) denotes a significant difference at P < 0.01.

References

    1. Albert I, Mavrich TN, Tomsho LP, Qi J, Zanton SJ, Schuster SC, et al. Translational and rotational settings of H2A.Z nucleosomes across the Saccharomyces cerevisiae genome. Nature. 2007;446:572–576. - PubMed
    1. Alexander SPH, Benson HE, Faccenda E, Pawson AJ, Sharman JL. Spedding M, et al. The Concise Guide to PHARMACOLOGY 2013/14: Enzymes. Br J Pharmacol. 2013;170:1797–1867. - PMC - PubMed
    1. Barrès R, Osler ME, Yan J, Rune A, Fritz T, Caidahl K, et al. Non-CpG methylation of the PGC-1α promoter through DNMT3B controls mitochondrial density. Cell Metab. 2009;10:189–198. - PubMed
    1. Barrès R, Yan J, Egan B, Treebak Jonas T, Rasmussen M, Fritz T, et al. Acute exercise remodels promoter methylation in human skeletal muscle. Cell Metab. 2012;15:405–411. - PubMed
    1. Berni Canani R, Di Costanzo M, Leone L. The epigenetic effects of butyrate: potential therapeutic implications for clinical practice. Clin Epigenetics. 2012;4:4. - PMC - PubMed

Publication types

MeSH terms