. 2015 Jan 12;212(1):5-14.
doi: 10.1084/jem.20141318. Epub 2015 Jan 5.

MD-2 is required for disulfide HMGB1-dependent TLR4 signaling

Affiliations

MD-2 is required for disulfide HMGB1-dependent TLR4 signaling

Huan Yang et al. J Exp Med. .

Abstract

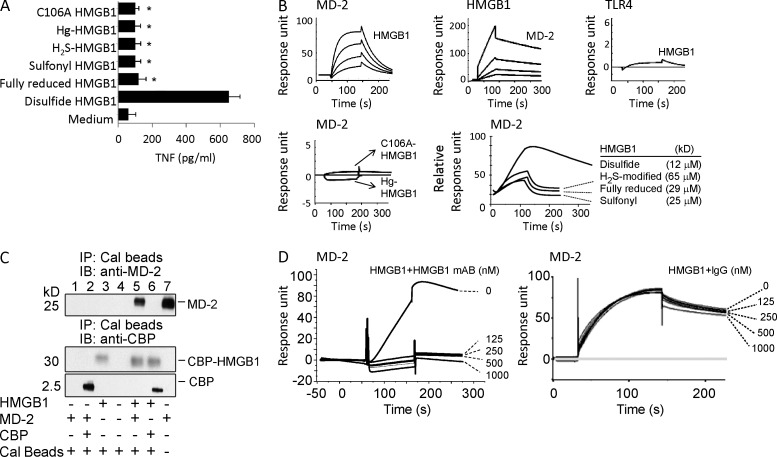
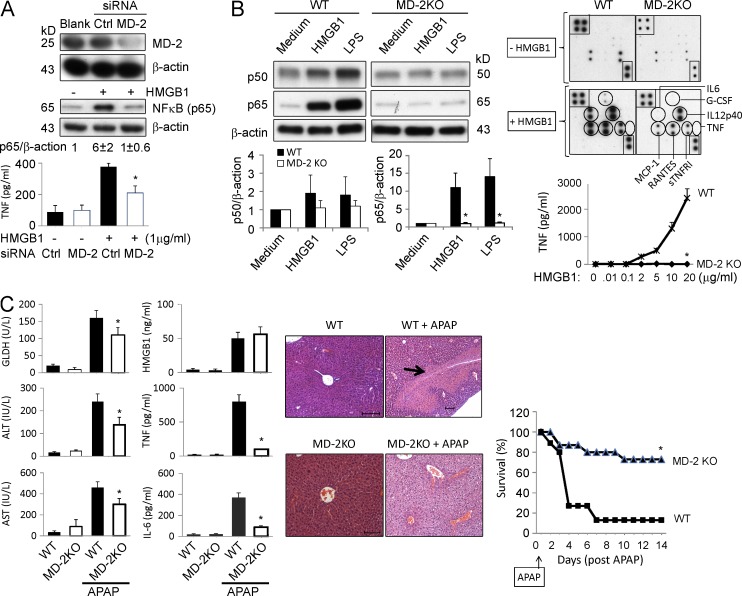
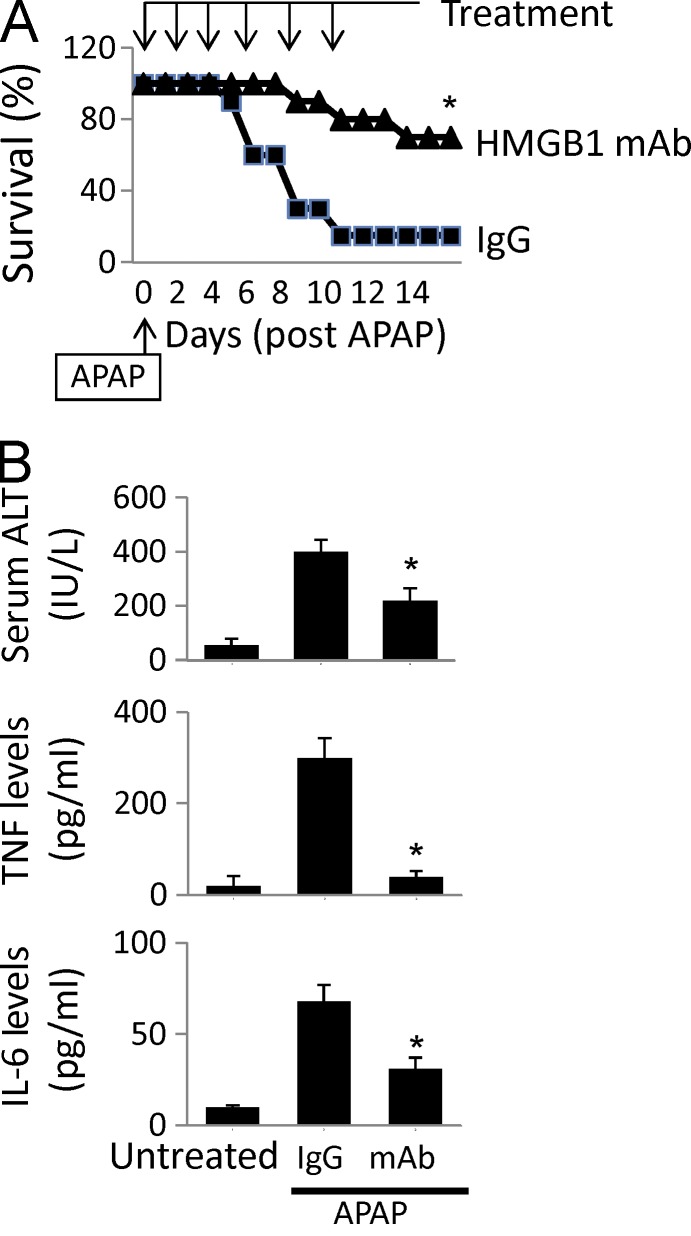
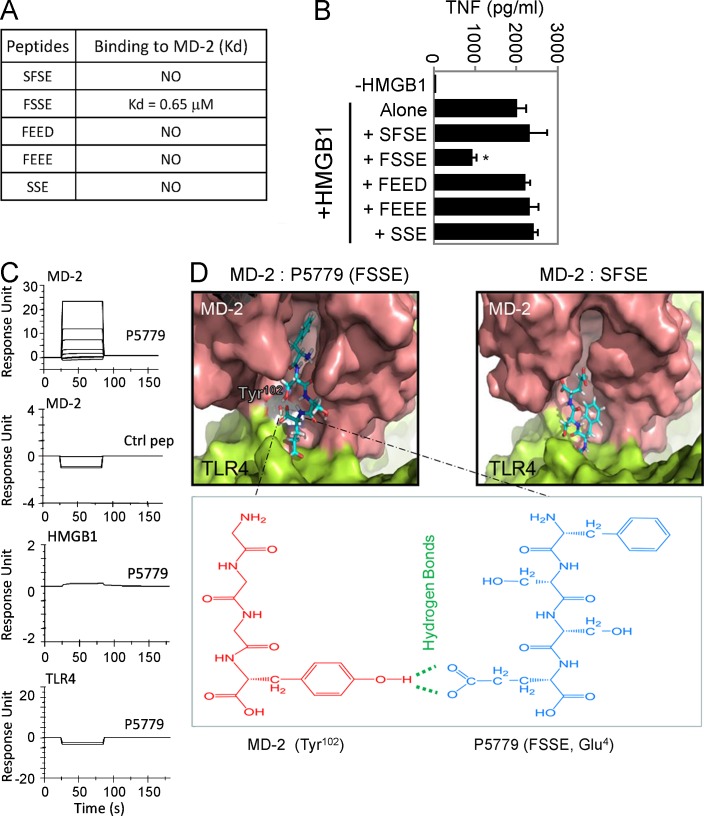
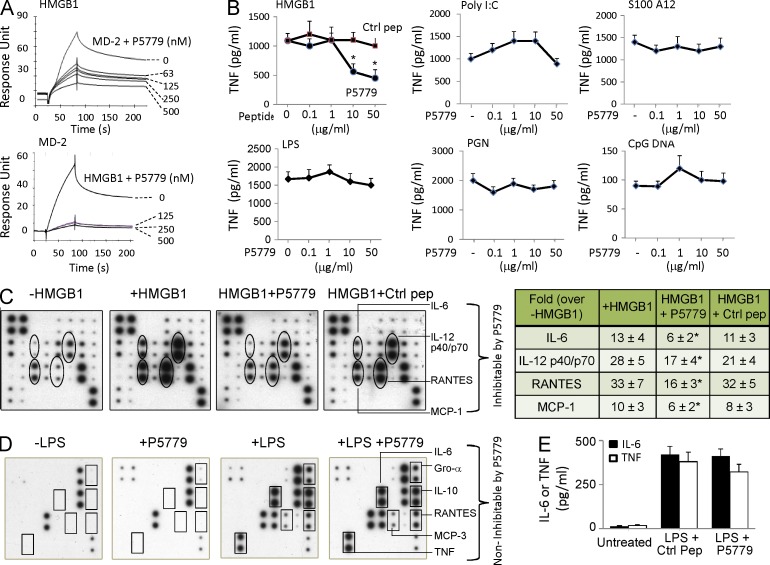
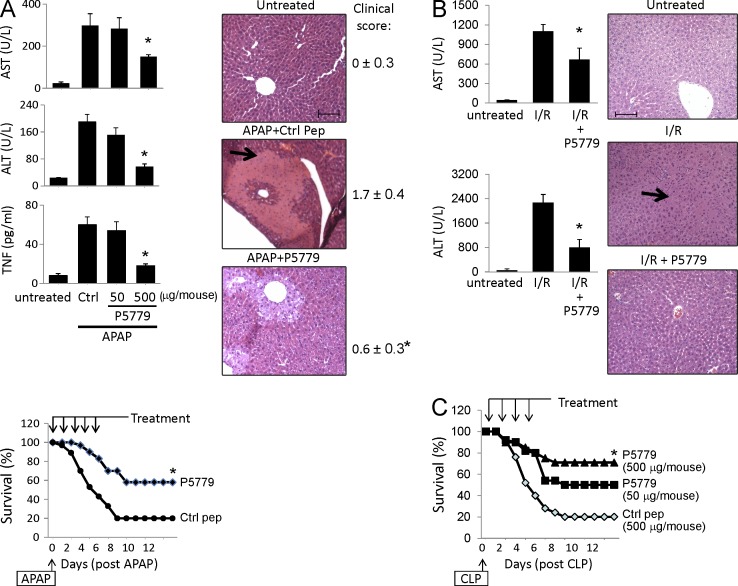
Innate immune receptors for pathogen- and damage-associated molecular patterns (PAMPs and DAMPs) orchestrate inflammatory responses to infection and injury. Secreted by activated immune cells or passively released by damaged cells, HMGB1 is subjected to redox modification that distinctly influences its extracellular functions. Previously, it was unknown how the TLR4 signalosome distinguished between HMGB1 isoforms. Here we demonstrate that the extracellular TLR4 adaptor, myeloid differentiation factor 2 (MD-2), binds specifically to the cytokine-inducing disulfide isoform of HMGB1, to the exclusion of other isoforms. Using MD-2-deficient mice, as well as MD-2 silencing in macrophages, we show a requirement for HMGB1-dependent TLR4 signaling. By screening HMGB1 peptide libraries, we identified a tetramer (FSSE, designated P5779) as a specific MD-2 antagonist preventing MD-2-HMGB1 interaction and TLR4 signaling. P5779 does not interfere with lipopolysaccharide-induced cytokine/chemokine production, thus preserving PAMP-mediated TLR4-MD-2 responses. Furthermore, P5779 can protect mice against hepatic ischemia/reperfusion injury, chemical toxicity, and sepsis. These findings reveal a novel mechanism by which innate systems selectively recognize specific HMGB1 isoforms. The results may direct toward strategies aimed at attenuating DAMP-mediated inflammation while preserving antimicrobial immune responsiveness.


Figures

Figure 1.
Figure 1.
Disulfide HMGB1 binds to MD-2. (A) TNF release was measured from RAW 264.7 cells stimulated with various isoforms of HMGB1 as indicated (1 µg/ml, 16 h). Data are presented as means ± SEM. *, P < 0.05 versus disulfide HMGB1. n = 3–5 experiments. (B) SPR (Biacore) analysis was performed to assess HMGB1 binding to MD-2 or TLR4 (coated on the chip). (top) HMGB1 binding to human MD-2 was tested at different HMGB1 concentrations (12.5, 25, 50, and 100 nM) with an apparent Kd of 12 nM (left). Human MD-2 (12.5, 25, 50, and 100 nM) binding to HMGB1 (coated on the chip; middle) and disulfide HMGB1 (100 nM) binding to TLR4 (coated on the chip; right) were tested. (bottom) Noncytokine-inducing HMGB1 (C106A, Hg-HMGB1, 1 µM) was tested for binding to MD-2 (coated on the chip; left). HMGB1 isoforms were tested for binding to MD-2 (coated on the chip; right). Data are presented as response units or relative response units over time (seconds) and are representative of three experiments. (C) Mixture of CBP-tagged HMGB1 or CBP alone with supernatant of yeast Sf9 cells expressing MD-2 was immunoprecipitated with calmodulin beads (immunoprecipitation [IP]), and immunoblotted (IB) with anti–human MD-2 or CBP antibodies. Recombinant MD-2 protein was included as positive control (right lane). Data shown are representative of three repeats. (D) SPR analysis of HMGB1 binding to human MD-2 (coated on the chip) was performed in the presence of anti-HMGB1 mAb (left) or irrelevant mouse IgG (right) as shown. Data are representative of three repeats.
Figure 2.
Figure 2.
MD-2 is indispensable for HMGB1-dependent TLR4 signaling. (A, top) Knockdown of MD-2 (siRNA) was performed on RAW 264.7 cells. MD-2 and NF-κB levels (p65) were assessed by Western blotting. The level of NF-κB (p65) protein was normalized relative to the level of β-actin (ratio) by densitometry and expressed as the fold change over unstimulated cells. (bottom) HMGB1-induced TNF release from RAW 264.7 cells with MD-2 knockdown (open bars) or control siRNA (closed bars). *, P < 0.05 versus control siRNA group. n = 4–5 experiments. (B, left) HMGB1 (2 µg/ml) or ultrapure LPS (200 ng/ml) was used to stimulate primary peritoneal macrophages from WT or MD-2 KO mice for 16 h, and NF-κB (p50 and p65) protein levels in nuclear extracts were assessed by Western blotting (top left). NF-κB activation is expressed as of p50 or p65 relative to β-actin and calculated as the fold change over unstimulated cells (bottom left). (right) Mouse macrophages were stimulated with HMGB1 and cytokine release was measured using mouse cytokine antibody array (G-CSF, IL-12p40, IL-6, TNF, RANTES, MCP-1, and sTNFR1; top right) or ELISA (for TNF; bottom right). *, P < 0.05 versus WT group. n = 5 separate experiments. (C, left) WT or MD-2 KO mice were challenged with APAP in a liver injury model and were euthanized 24 h later to measure serum levels of liver enzymes (GLDH, ALT, and AST; left column of graphs) and cytokines (HMGB1, TNF, and IL-6; right column of graphs). *, P < 0.05 versus WT APAP group. n = 5–13 mice per group. (middle) Representative H&E staining of liver tissues from these mice are shown. n = 5–8 mice per group (the arrow indicates necrosis region). Bars, 100 µm. (right) Animal survival after receiving a lethal dose of APAP in WT and MD-2 KO mice was assessed (percent survival). *, P < 0.05 versus WT. n = 15 mice per group. (A–C) Data are presented as means ± SEM.
Figure 3.
Figure 3.
Anti-HMGB1 mAb administration ameliorates APAP-induced liver injury in mice. (A) Mice received an APAP injection (i.p.) followed by treatment with an anti-HMGB1 antibody or control IgG injection (i.p.; see Materials and methods). Animal survival (percent survival) was assessed. n = 20 mice/group. *, P < 0.05 versus IgG group. (B) Serum levels of liver enzyme (ALT) and cytokines (TNF and IL-6) at 24 h after APAP were measured in mice receiving treatment of anti-HMGB1 antibody or control IgG (see Materials and methods). *, P < 0.05 versus IgG group. n = 10 mice/group. (A and B) Data are presented as means ± SEM.
Figure 4.
Figure 4.
Screening for HMGB1 inhibitors. (A) SPR analysis was performed to test the interaction of MD-2 (coated on the chip) with P5779 (FSSE) and other peptides (100 nM). Kd values are shown. Data are representative of three experiments. (B) Primary human macrophages were stimulated in vitro with HMGB1 (1 µg/ml) plus different peptides (50 µg/ml) for 16 h, and TNF release was measured by ELISA. Data are presented as means ± SEM. *, P < 0.05 versus HMGB1 alone. n = 4–5 experiments. (C) SPR analysis was performed to measure binding of P5779 (12.5, 25, 50, and 100 nM) or scrambled control (ctrl) peptide (100 nM) to human MD-2 (Kd = 0.65 µM for P5779), HMGB1, or TLR4 (coated on the chip). Data are representative of three experiments. (D) Schematic illustration showing molecular docking of MD-2 with tetramer peptides FSSE (left) and SFSE (right). The pink area represents the surface of the peptide-binding pocket of MD-2, and the green area denotes the TLR4 protein surface. The bottom panel shows hydrogen bonds and van der Waals interactions. P5779, with a stronger van der Waals interaction than control, is fully extended into the hydrophobic pocket of MD-2 and forms an additional hydrogen bond with Tyr102 of MD-2.
Figure 5.
Figure 5.
Development of a tetramer peptide (P5779) as an MD-2–binding HMGB1-specific inhibitor. (A) On SPR analysis, HMGB1 was coated on the chip and MD-2 (1 µM) was flowed over as analyte, plus different amounts of P5779 as shown. Inhibition of HMGB1 binding to MD-2 by P5779 (IC50 = 29 nM) was assessed (top). In the reverse experiment, human MD-2 was coated on the chip, and HMGB1 (1 µM) plus different amounts of P5779 were added as analytes. HMGB1 binding to MD-2 was inhibited by P5779 (IC50 = 2 nM; bottom). Data are representative of three separate experiments. (B) Human primary macrophages, isolated from human blood, were stimulated with HMGB1 (1 µg/ml) or other stimuli (Poly I:C, S100A12, LPS, PGN, and CpG DNA) in vitro, plus increasing amounts of P5779 (or scrambled control peptide) for 16 h. TNF release was measured by ELISA. *, P < 0.05 versus HMGB1 plus control peptide (ctrl). n = 4–5 experiments. (C) Thioglycollate-elicited peritoneal mouse macrophages were stimulated in vitro with HMGB1 (1 µg/ml) plus P5779 or control peptide (50 µg/ml) for 16 h, and extracellular levels of various cytokines were analyzed by mouse cytokine antibody array (left). Data are representative of three to four experiments, each performed in duplicate and expressed as fold increase over unstimulated cells using densitometry (-HMGB1; right table). *, P < 0.05 versus +HMGB1 group. (D) Primary human macrophages, isolated from blood, were stimulated in vitro with LPS (2 ng/ml) for 16 h in the absence or presence of P5779 (50 µg/ml) or control peptide, and extracellular levels of various cytokines were analyzed by human cytokine antibody array. Data are representative of three repeats. (E) Male C57BL/6 mice received an LPS injection (8 mg/kg, i.p.) plus P5779 or control peptide (500 µg/mouse, i.p.). Animals were euthanized 90 min later. Serum TNF and IL-6 levels were measured by ELISAs. n = 5 mice per group. (B and E) Data are presented as means ± SEM.
Figure 6.
Figure 6.
Treatment with the HMGB1 inhibitor P5779 ameliorates APAP-mediated toxicity, I/R injury, and sepsis mortality in vivo. (A, top left) C57BL/6 mice received an APAP injection (i.p.; see Materials and methods) and were administered with P5779 (at doses indicated) or control peptide (ctrl; 500 µg/mouse, i.p.). Mice were euthanized at 24 h after APAP, and serum enzyme (ASL and ALT) and cytokine (TNF) levels were measured by ELISAs. n = 6–10 mice per group. (bottom left) In survival experiments, mice received an APAP injection (i.p.) and were administered with P5779 or control peptide (i.p.; see Materials and methods). Survival was monitored for 2 wk (percent survival). n = 30 mice/group. (right) Representative H&E images of liver tissue sections are shown for normal (untreated) or APAP-injected mice receiving P5779 or control peptides. Clinical scores were assessed and are shown on the right. Liver necrosis is demonstrated by an arrow. n = 6–10 mice/group. *, P < 0.05 versus control peptide group. (B, left) P5779 or control peptide was administered (500 µg/mouse, i.p.) at the time of I/R surgery, and mice were euthanized 6 h later to measure serum levels of ALT and AST and to evaluate histological liver injury. *, P < 0.05 versus I/R group. n = 5–7 mice/group. (right) Representative H&E liver tissue sections are shown (neutrophil infiltration: arrow). n = 3–5 mice per group. (A and B) Data are presented as means ± SEM. Bars, 100 µm. (C) Mice received CLP surgery, and P5779 or control peptide was administered i.p. at the doses indicated. Animal survival was monitored for 2 wk (percent survival). *, P < 0.05 versus control peptide group. n = 20 mice/group.

Similar articles

Cited by

References

    1. Andersson U., and Tracey K.J.. 2011. HMGB1 is a therapeutic target for sterile inflammation and infection. Annu. Rev. Immunol. 29:139–162 10.1146/annurev-immunol-030409-101323 - DOI - PMC - PubMed
    1. Antoine D.J., Jenkins R.E., Dear J.W., Williams D.P., McGill M.R., Sharpe M.R., Craig D.G., Simpson K.J., Jaeschke H., and Park B.K.. 2012. Molecular forms of HMGB1 and keratin-18 as mechanistic biomarkers for mode of cell death and prognosis during clinical acetaminophen hepatotoxicity. J. Hepatol. 56:1070–1079 10.1016/j.jhep.2011.12.019 - DOI - PMC - PubMed
    1. Antoine D.J., Dear J.W., Lewis P.S., Platt V., Coyle J., Masson M., Thanacoody R.H., Gray A.J., Webb D.J., Moggs J.G., et al. . 2013. Mechanistic biomarkers provide early and sensitive detection of acetaminophen-induced acute liver injury at first presentation to hospital. Hepatology. 58:777–787 10.1002/hep.26294 - DOI - PMC - PubMed
    1. Chen G.Y., Tang J., Zheng P., and Liu Y.. 2009. CD24 and Siglec-10 selectively repress tissue damage-induced immune responses. Science. 323:1722–1725 10.1126/science.1168988 - DOI - PMC - PubMed
    1. Deng M., Scott M.J., Loughran P., Gibson G., Sodhi C., Watkins S., Hackam D., and Billiar T.R.. 2013. Lipopolysaccharide clearance, bacterial clearance, and systemic inflammatory responses are regulated by cell type-specific functions of TLR4 during sepsis. J. Immunol. 190:5152–5160 10.4049/jimmunol.1300496 - DOI - PMC - PubMed

Publication types

MeSH terms

Associated data