

The relationship between serum potassium, potassium variability and in-hospital mortality in critically ill patients and a before-after analysis on the impact of computer-assisted potassium control
- PMID: 25560457
- PMCID: PMC4312438
- DOI: 10.1186/s13054-014-0720-9
The relationship between serum potassium, potassium variability and in-hospital mortality in critically ill patients and a before-after analysis on the impact of computer-assisted potassium control
Abstract
Introduction: The relationship between potassium regulation and outcome is not known. Our first aim in the present study was to determine the relationship between potassium level and variability in (ICU) stay and outcome. The second aim was to evaluate the impact of a computer-assisted potassium regulation protocol.
Methods: We performed a retrospective before-after study including all patients >15 years of age admitted for more than 24 hours to the ICU of our university teaching hospital between 2002 and 2011. Potassium control was fully integrated with computerized glucose control (glucose and potassium regulation program for intensive care patients (GRIP-II)). The potassium metrics that we determined included mean potassium, potassium variability (defined as the standard deviation of all potassium levels) and percentage of ICU time below and above the reference range (3.5 through 5.0 mmol/L). These metrics were determined for the first ICU day (early phase) and the subsequent ICU days (late phase; that is, day 2 to day 7). We also compared potassium metrics and in-hospital mortality before and after GRIP-II was implemented in 2006.
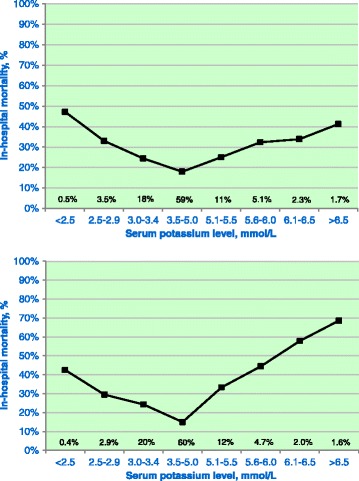
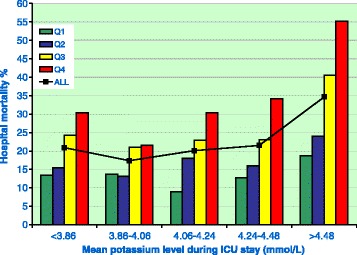
Results: Of all 22,347 ICU admissions, 10,451 (47%) patients were included. A total of 206,987 potassium measurements were performed in these patients. Glucose was regulated by GRIP-II in 4,664 (45%) patients. The overall in-hospital mortality was 22%. There was a U-shaped relationship between the potassium level and in-hospital mortality (P <0.001). Moreover, potassium variability was independently associated with outcome. After implementation of GRIP-II, in the late phase the time below 3.5 mmol/L decreased from 9.2% to 3.9% and the time above 5.0 mmol/L decreased from 6.1% to 5.2%, and potassium variability decreased from 0.31 to 0.26 mmol/L (all P <0.001). The overall decrease in in-hospital mortality from 23.3% before introduction of GRIP-II to 19.9% afterward (P <0.001) was not related to a specific potassium subgroup.
Conclusions: Hypokalemia, hyperkalemia and potassium variability were independently associated with increased mortality. Computerized potassium control clearly resulted in improved potassium metrics.
Figures

References
MeSH terms
Substances
LinkOut - more resources
Full Text Sources
Other Literature Sources
Medical
