

Inhibition of Lipid Oxidation Increases Glucose Metabolism and Enhances 2-Deoxy-2-[(18)F]Fluoro-D-Glucose Uptake in Prostate Cancer Mouse Xenografts
- PMID: 25561013
- PMCID: PMC4493937
- DOI: 10.1007/s11307-014-0814-4
Inhibition of Lipid Oxidation Increases Glucose Metabolism and Enhances 2-Deoxy-2-[(18)F]Fluoro-D-Glucose Uptake in Prostate Cancer Mouse Xenografts
Abstract
Purpose: Prostate cancer (PCa) is the second most common cause of cancer-related death among men in the United States. Due to the lipid-driven metabolic phenotype of PCa, imaging with 2-deoxy-2-[(18)F]fluoro-D-glucose ([(18)F]FDG) is suboptimal, since tumors tend to have low avidity for glucose.
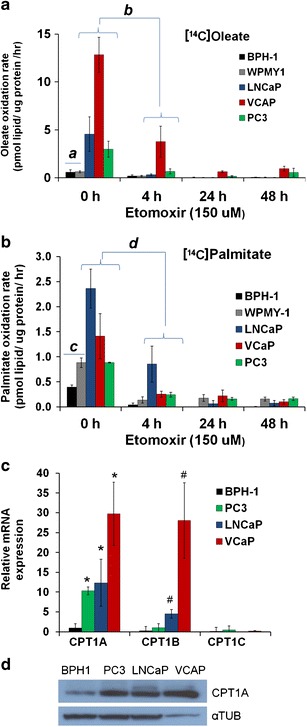
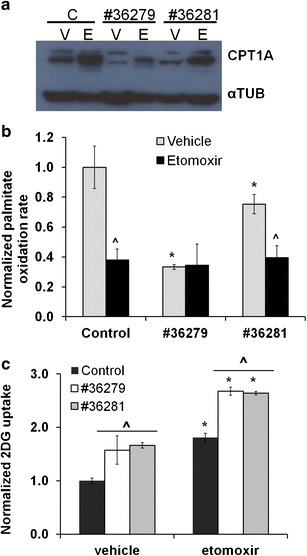
Procedures: We have used the fat oxidation inhibitor etomoxir (2-[6-(4-chlorophenoxy)-hexyl]oxirane-2-carboxylate) that targets carnitine-palmitoyl-transferase-1 (CPT-1) to increase glucose uptake in PCa cell lines. Small hairpin RNA specific for CPT1A was used to confirm the glycolytic switch induced by etomoxir in vitro. Systemic etomoxir treatment was used to enhance [(18)F]FDG-positron emission tomography ([(18)F]FDG-PET) imaging in PCa xenograft mouse models in 24 h.
Results: PCa cells significantly oxidize more of circulating fatty acids than benign cells via CPT-1 enzyme, and blocking this lipid oxidation resulted in activation of the Warburg effect and enhanced [(18)F]FDG signal in PCa mouse models.
Conclusions: Inhibition of lipid oxidation plays a major role in elevating glucose metabolism of PCa cells, with potential for imaging enhancement that could also be extended to other cancers.
Conflict of interest statement
Authors declare no conflicts of interest.
Figures


Similar articles
-
Noninvasive evaluation of fat-carbohydrate metabolic switching in heart and contracting skeletal muscle.Am J Physiol Endocrinol Metab. 2019 Feb 1;316(2):E251-E259. doi: 10.1152/ajpendo.00323.2018. Epub 2018 Dec 4. Am J Physiol Endocrinol Metab. 2019. PMID: 30512988 Free PMC article.
-
Lipid catabolism via CPT1 as a therapeutic target for prostate cancer.Mol Cancer Ther. 2014 Oct;13(10):2361-71. doi: 10.1158/1535-7163.MCT-14-0183. Epub 2014 Aug 13. Mol Cancer Ther. 2014. PMID: 25122071 Free PMC article.
-
More advantages in detecting bone and soft tissue metastases from prostate cancer using 18F-PSMA PET/CT.Hell J Nucl Med. 2019 Jan-Apr;22(1):6-9. doi: 10.1967/s002449910952. Epub 2019 Mar 7. Hell J Nucl Med. 2019. PMID: 30843003
-
PET of Glucose Metabolism and Cellular Proliferation in Prostate Cancer.J Nucl Med. 2016 Oct;57(Suppl 3):25S-29S. doi: 10.2967/jnumed.115.170704. J Nucl Med. 2016. PMID: 27694167 Free PMC article. Review.
-
Influence of etomoxir on the expression of several genes in liver, testis and heart.Gen Pharmacol. 1995 Sep;26(5):897-904. doi: 10.1016/0306-3623(94)00281-q. Gen Pharmacol. 1995. PMID: 7557264 Review.
Cited by
-
Human DECR1 is an androgen-repressed survival factor that regulates PUFA oxidation to protect prostate tumor cells from ferroptosis.Elife. 2020 Jul 20;9:e54166. doi: 10.7554/eLife.54166. Elife. 2020. PMID: 32686647 Free PMC article.
-
CDK9 Inhibition Induces a Metabolic Switch that Renders Prostate Cancer Cells Dependent on Fatty Acid Oxidation.Neoplasia. 2019 Jul;21(7):713-720. doi: 10.1016/j.neo.2019.05.001. Epub 2019 May 28. Neoplasia. 2019. PMID: 31151054 Free PMC article.
-
CPT1A Over-Expression Increases Reactive Oxygen Species in the Mitochondria and Promotes Antioxidant Defenses in Prostate Cancer.Cancers (Basel). 2020 Nov 18;12(11):3431. doi: 10.3390/cancers12113431. Cancers (Basel). 2020. PMID: 33218188 Free PMC article.
-
Effective Detection and Monitoring of Glioma Using [18F]FPIA PET Imaging.Biomedicines. 2021 Jul 13;9(7):811. doi: 10.3390/biomedicines9070811. Biomedicines. 2021. PMID: 34356874 Free PMC article.
-
Revealing potential lipid biomarkers in clear cell renal cell carcinoma using targeted quantitative lipidomics.Lipids Health Dis. 2021 Nov 13;20(1):160. doi: 10.1186/s12944-021-01572-z. Lipids Health Dis. 2021. PMID: 34774030 Free PMC article.
References
Publication types
MeSH terms
Substances
Grants and funding
LinkOut - more resources
Full Text Sources
Other Literature Sources
Medical
