. 2015 Feb 5;518(7537):111-114.
doi: 10.1038/nature14128. Epub 2015 Jan 7.

Optogenetic control of organelle transport and positioning

Affiliations

Optogenetic control of organelle transport and positioning

Petra van Bergeijk et al. Nature. .

Abstract

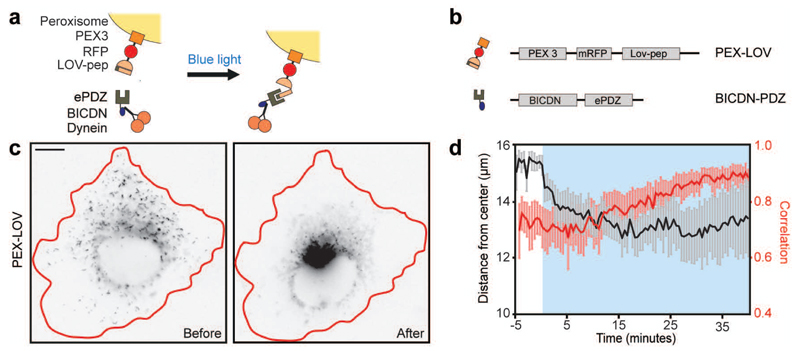
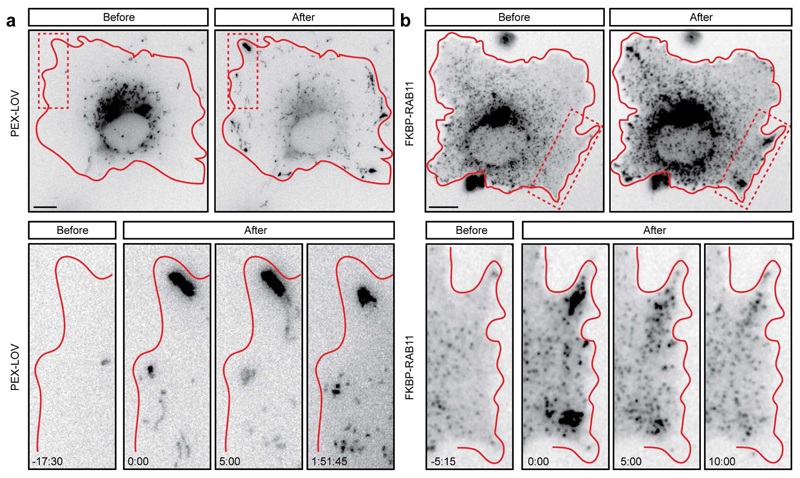
Proper positioning of organelles by cytoskeleton-based motor proteins underlies cellular events such as signalling, polarization and growth. For many organelles, however, the precise connection between position and function has remained unclear, because strategies to control intracellular organelle positioning with spatiotemporal precision are lacking. Here we establish optical control of intracellular transport by using light-sensitive heterodimerization to recruit specific cytoskeletal motor proteins (kinesin, dynein or myosin) to selected cargoes. We demonstrate that the motility of peroxisomes, recycling endosomes and mitochondria can be locally and repeatedly induced or stopped, allowing rapid organelle repositioning. We applied this approach in primary rat hippocampal neurons to test how local positioning of recycling endosomes contributes to axon outgrowth and found that dynein-driven removal of endosomes from axonal growth cones reversibly suppressed axon growth, whereas kinesin-driven endosome enrichment enhanced growth. Our strategy for optogenetic control of organelle positioning will be widely applicable to explore site-specific organelle functions in different model systems.


Conflict of interest statement

The authors declare no competing financial interests.

Figures

Extended Data Figure 1
Extended Data Figure 1. Optical control of dynein-based cargo motility
a,b, Assay: A fusion construct of PEX3, mRFP and LOVpep (PEX-LOV) targets peroxisomes. Upon blue-light illumination, a fusion of the N-terminus of the dynein adaptor BICD and ePDZb1 (BICDN-PDZ) is recruited to peroxisomes. c, Peroxisome distribution in a COS-7 cell expressing PEX-LOV and BICDN-PDZ before and during light-induced recruitment of dynein (inverted contrast). Red lines indicate cell outline. Scale bar is 10μm. See Supplementary Video S1. d, Black: Time trace of the R90% (radius of circle enclosing 90% of cellular fluorescence; see Experimental Procedures) in cells expressing PEX-LOV and BICDN-PDZ (n=5 cells). Red: correlation index (frame-to-frame differences in the peroxisome recordings; see Experimental Procedures) of the same cells. Blue-light illumination is indicated in blue and error bars depict SEM.
Extended Data Figure 2
Extended Data Figure 2. Light-induced organelle redistribution is organelle-specific and does not affect the cytoskeleton.
a, Images of fixed cells expressing PEX-LOV and KIF-PDZ, showing the distribution of peroxisomes and mitochondria (α-cytochrome-c), or peroxisomes and the endoplasmic reticulum (α-PDI) in the absence (left) or presence (right) of blue light . b, Images of fixed cells expressing PEX-LOV and KIF-PDZ, showing the distribution of peroxisomes and phalloidin, alpha-tubulin or EB1 staining in the absence or presence of blue light. c, Images of fixed cells expressing FKBP-RAB11, FRB-LOV and KIF-PDZ, showing the distribution of Rab11 recycling endosomes together with lysosomes (α-Lamp1) or early endosomes (α-EEA1) in the absence or presence of blue light. Inverted contrast, scale bars in a, b, and c are 10μm and red lines indicate cell outline.
Extended Data Figure 3
Extended Data Figure 3. After light induced organelle displacement, peroxisomes remain at their newly obtained position whereas the distribution of recycling endosomes quickly reverses back to normal.
a, Peroxisome distribution before and after exposure to blue light in cells expressing PEX-LOV and KIF-PDZ. Blue-light illumination was terminated at t0:00. b, Distribution of Rab11 recycling endosomes before and after exposure to blue light in cells expressing FKBP-RAB11, FRB-LOV and KIF-PDZ. Blue light was turned off at t0:00. Inverted contrast, scale bars in a and b are 10μm and red lines indicate cell outline. See Supplementary Video S4.
Extended Data Figure 4
Extended Data Figure 4. Spatiotemporal control of recycling endosome distribution and dynamics.
a, b, Assay: A fusion construct of Cryptochrome 2, tagRFPt and Rab11, (CRY-RAB11) targets Rab11 recycling endosomes. Upon blue-light illumination, a fusion of truncated KIF1A, GFP and CIBN (KIF-CIBN) or a fusion of truncated BICDN, GFP and CIBN (BICDN-CIBN) is recruited to Rab11 recycling endosomes. c, Rab11 vesicle distribution before and after light-induced recruitment of KIF1A (inverted contrast). Red lines indicate cell outline. Scale bar is 10μm. d, Overlay of sequential binarized images from the recording in (c), color-coded by time as indicated. Orange marks the initial distribution of Rab11 vesicles, whereas green marks regions targeted after exposure to blue-light. e, Time trace of the R60% and R90% (black) and the correlation index (red) of the cell shown in (c, d). Blue box marks blue-light illumination. f, Rab11 distribution in a cell expressing CRY-RAB11, and BICDN-CIBN before and after blue-light illumination (inverted contrast). Red lines indicate cell outline. Scale bar is 10μm. g, Time trace of the R60% and R90% (black) and correlation index for the cell shown in (f). h, Irradiance response curve for cells transfected with CRY-PEX and KIF-CIBN (red), or PEX-LOV plus KIF-PDZ (black). To exclude activation failure due to poorly expressed motors, the number of cells reacting at each concentration was divided by the number of cells responding to subsequent high irradiance (~1.3 W cm-2). N=3 biological replicates. Cells per intensity (for increasing intensities): 28, 21, 22, 20, 24, 22, 20 for Cry, 30, 28, 33, 31, 28, 33, 33, 32, 26 for LOV. Error bars depict SEM. Solid line shows fit to R=100-In/(I0n+In) with R the response, I the illumination intensity, I0 the intensity at which the response is 50%, and n the Hill coefficient. For CRY-PEX and PEX-LOV, I0 is 0.05 and 0.12 W cm-2, respectively. i, j, Assay: A fusion construct of FKBP, tagRFPt and Rab11, (FKBP-RAB11) targets Rab11 recycling endosomes. Rapalog addition couples FKBP to FRB, leading to recruitment of the FRB, tagBFP and LOVpep fusion protein (FRB-LOV). Upon blue-light illumination a fusion of truncated Myosin-Vb, GFP and ePDZb1 (MYO-PDZ) is recruited to Rab11 vesicles. k, Rab11 distribution in a cell expressing FKBP-RAB11, FRB-LOV, and MYO-PDZ before sequential blue-light illumination of the regions marked with numbered boxes (inverted contrast). Scale bar is 10μm. See Supplementary Video S5. l, Time traces of the correlation index in the areas shown in (k). Blue box marks whole-cell exposure to blue light, whereas colored boxes indicate local illumination. m, Example trajectories of two Rab11 recycling endosomes before, during and after recruitment of myosin-Vb, as indicated. Data was acquired with 1s intervals. For each period 40 seconds are shown. n, Frame-to-frame displacements of Rab11 recycling endosomes before, during and after light-induced recruitment of myosin-Vb. Thick lines show the average of five tracks in shades of gray. o, FKBP-RAB11 distribution (inverted contrast) in a dendrite and dendritic spines before, during and after blue-light illumination. Images are maximum projections spanning 60s. Red lines indicate cell outline, arrowheads mark spines targeted with recycling endosomes during blue-light illumination. Scale bar is 2μm. p, Percentage of recycling endosome spine entry events per dendrite before, during and after illumination in bins of 100s. Blue box indicates blue-light illuminated interval, n=16 dendrites in N=3 independent experiments. Red bar is mean ± SEM (error bars), *** p<0.0001, one-way ANOVA, Bonferroni’s post-hoc test. q, Histogram of fraction of all (n=237) recycling endosome spine entries in bins of 20s. Blue box indicate blue light-illuminated interval.
Extended Data Figure 5
Extended Data Figure 5. Rapalog in the nanomolar range is sufficient to recruit FRB-LOV to FKBP-RAB11 and does not affect the number of spines or growth cones in hippocampal neurons.
a, Response curve of peroxisome relocalization in cells expressing FKBP-RAB11, FRB-LOV, and KIF-PDZ exposed to blue light in relation to rapalog concentration. To exclude activation failure due to poorly expressed motors, the number of cells reacting at each concentration was divided by the number of cells responding to subsequent high rapalog concentration (1 μM). Solid line shows fit to R=(RminI0n+100In)/(I0n+In), with R the response, c the rapalog concentration, c0 the concentration at which the response is 50%, n the Hill coefficient, and Rmin the response at 0 mM rapalog. Rmin is 22% and c0 is 15 nM. n=30 (0.1nM), 37 (1nM), 30 (10nM), 28 (100nM) and 28 (500nM) responsive cells from N=3 independent experiments. Error bars depict SEM. b, Hippocampal neurons transfected with membrane-RFP incubated for 2.5 hours in the presence or absence of 100nM rapalog, co-stained with the post-synaptic marker Homer. c, Quantification of the number of Homer puncta per 100μm dendrite length in the presence or absence of 100nM rapalog. (n=13 neurons per condition). Error bars depict SEM. d, Hippocampal neurons transfected with GFP incubated for 2.5 hours in the presence or absence of 100nM rapalog, co-stained with phalloidin. e, Quantification of the number of growth cones per 50.000μm2 in the presence or absence of 100nM rapalog, co-stained with phalloidin. n=19. Scale bars in b and d are 5μm. Error bars depict SEM.
Extended Data Figure 6
Extended Data Figure 6. Rab11 fusion constructs are recognized by the Rab11 antibody, partially co-localize with transferrin receptors and interact with Rab11FIP1.
a, Images of untransfected cells or cells transfected with CRY-RAB11, FKBP-RAB11 or TagRFPt-Rab11, co-stained with anti-Rab11 antibody (Inverted contrast). Red lines indicate cell outline. Scale bar is 2.5μm. b, Images of cells transfected with TfR-GFP only, or co-transfected with CRY-RAB11, FKBP-RAB11 or TagRFPt-Rab11 (Inverted contrast). Red lines indicate cell outline. Scale bar is 2.5μm. c,d,e, GFP pull-down assays with lysates of HEK cells expressing GFP or GFP-Rab11FIP1 together with TagRFPt-Rab11 (c), FKBP-RAB11 or FKBP-TagRFPt-Rab6 (d) or CRY-RAB11 (e) were analyzed by Western Blotting using antibodies against TagRFPt and GFP.
Extended Data Figure 7
Extended Data Figure 7. BICDN overexpression does not significantly inhibit dynein-based transport and the growth cone cytoskeleton is not affected by light-induced recruitment of BICDN to recycling endosomes.
a,b, Left: Kymograph of dense-core vesicles motility in an axon expressing NPY-GFP and empty vector (a) or BICDN-PDZ (b) (inverted contrast), representative of n=5 and n=10 axons, respectively. Right: Corresponding binary image of traces used for further analysis of anterograde and retrograde movements. Scale bars are 5μm and 10s. c, Position of dense-core vesicles along an axon expressing NPY-GFP and BICDN-PDZ. Single colored arrowheads point to the same vesicle, highlighting retrograde (red), anterograde (black) and non-moving (yellow) vesicles. Scale bar is 5μm. d, Quantification of the percentage of static, anterograde and retrograde moving vesicles from kymographs shown in (a, b) in axons with (n=10) or without (n=5) BICDN-PDZ overexpression. Graph shows mean ± SEM, * p>0.05, 1-way ANOVA and Bonferroni's Multiple Comparison Test. e, Assay: A fusion of FRB, tagBFP and Lov-pep (FRB-LOV) and a fusion of GFP and ePDZb1 (PDZ) were expressed in neurons. Upon blue-light illumination, LOVpep undergoes a conformational change, allowing binding of PDZ to FRB-LOV. f, Actin dynamics in growth cones coexpressing mRFP-actin along with the constructs shown in (e), in response to light-induced heterodimerization of FRB-LOV and PDZ, representative for n=5 growth cones. The blue box indicates the interval of blue-light illumination. Scale bar is 5μm. g, Imaging of microtubule (MT) +TIP-tdTomato shows the dynamics of microtubule plus-ends in growth cones before and during blue-light illumination in neurons co-expressing FKBP-RAB11, FRB-LOV and BICDN-PDZ. Red line indicates cell outline, arrowheads point at plus-ends. Scale bar is 5μm. h, Kymograph of MT+TIPs of the growth cone shown in (g) and binarized traces used for analysis, representative for n=4 growth cones. Blue box indicates blue-light illumination interval. Scale bars are 5μm and 1min. i, Area measurement of growth cone shown in (g) before and during blue-light illumination. j, Quantification of the number of MT+TIPs traces per minute in growth cones before and during blue-light illumination (n=4 neurons).Graph shows mean ± SEM. Paired two-tailed t-test, n=4 cells. k, Quantification of the growth length of MT+TIPs traces in growth cones before and during blue-light illumination (n=4 neurons). Graph shows mean ± SEM. Paired two-tailed t-test, n=4 cells. l, Distribution of fraction of MT+TIP traces per growth length in bins of 0.5μm (n=214 traces). m, Quantification of the growth speed of MT+TIPs traces in growth cones before and during blue-light illumination (n=4 neurons). Graph shows mean ± SEM. Paired two-tailed t-test, n=4 cells. n, Distribution of fraction of MT+TIP traces per growth speed in bins of 0.1μm/s (n=214 traces).
Extended Data Figure 8
Extended Data Figure 8. Intensity rescaling and accurate growth cone area measurements based on Rab11 fluorescence.
a, Mean intensity of growth cone FKBP-RAB11 fluorescence from neurons expressing BICDN-PDZ in the absence (black, n=21) or in the presence of FRB-LOV (red, n=25) normalized to the intensity before (t2:30min) (left axis) and rescaled relatively to the intensity of -LOV growth cones at t8min (right axis). Blue box indicates blue-light illuminated interval. Graph shows mean ± SEM. b, Quantification of FKBP-RAB11 fluorescence intensity in the same neurons as shown in (a) after 8 minutes of blue-light illumination, normalized to the average fluorescence at t8min in control neurons. Graph shows mean ± SEM, *** p<0.0001, Mann-Whitney test. c, Area measurements of two representative growth cones from neurons expressing FKBP-RAB11, FRB-LOV, BICDN-PDZ and soluble GFP over time. Representative of 5 growth cones (shown in d and e). d, Normalized tagRFPt-Rab11 intensity of 5 growth cones as in (c) plotted against their normalized GFP intensity. Intensity values are averaged over the first five frames per growth cone. Pearson correlation coefficient (r) for each growth cone is indicated in top left corner. Same color indicates measurements of the same growth cone. e, FKBP-RAB11-based area measurements plotted against GFP-based area measurements of the same growth cones as in (d). Pearson correlation coefficient (r) for each growth cone is indicated in top left corner. Same color indicates measurements of the same growth cone. f, Traces of growth cone area measurements in the absence (n=25, red trace) and presence of FRB-LOV (n=21, black trace) in growth cones before and during blue-light illumination (See Experimental Procedures). Graph shows mean ± SEM. Blue box indicates blue light-exposed interval. g, Quantification of the area increase in the absence and presence of FRB-LOV in growth cones during blue-light illumination (-4 to 0 min).Values per growth cone are averaged over three frames. Graph shows mean ± SEM, n.s. p=0.4145, Mann-Whitney test. h, Cumulative histogram showing the fraction of growth cones with area shrinkage or growth (left or right of dashed line, respectively) before blue-light illumination (-4 to 0 min). Values per growth cone are averaged over three frames. i, Quantification of the area change of –FRB-LOV and +FRB-LOV growth cones during blue-light illumination (0 to 8 min). Values per growth cone are averaged over three frames. Graph shows mean ± SEM, * p=0.0206, Mann-Whitney test. j, Cumulative histogram showing the fraction of growth cones with area shrinkage or growth (left or right of dashed line, respectively) during blue-light illumination (0-8 min). Values per growth cone are averaged over three frames. k, Scatter plot showing net growth during blue-light illumination and normalized fluorescence intensity after blue-light illumination per +FRB-LOV (red) or –FRB-LOV (black) growth cone.
Figure 1
Figure 1. Local and reversible activation of microtubule-based transport with light.
a, b, Assay and constructs. NC: neck coil. c, Peroxisome distribution before and after light-induced recruitment of KIF-PDZ. d, Color-coded overlay of time series. e, Displacement (black, expressed in R90%) and correlation (frame-to-frame similarity from 0-1, red) versus time (n=6 cells, mean±SEM). Blue marks illumination. f, g, Reversible activation using pulsed light. g, Maximum intensity projections during periods of 40 seconds. See Video S2. h, Displacement (black, R90%) and correlation (red) versus time. i-l, Local activation using sequential illumination of four regions (i), resulting in outward targeting to adjacent regions (j, showing example trajectories), quantified using normalized fluorescence intensity (k,l, colored boxes mark blue-light illumination). See Video S3. Scale bars in c, f and i are 10 μm.
Figure 2
Figure 2. Light-induced Myosin-Vb recruitment anchors organelles or targets them into dendritic spines.
a, b, Assay and constructs. c, Peroxisome distribution in cell expressing PEX-LOV, KIF-PEX and MYO-PDZ. d, Correlation time trace for areas shown in (c). e, Peroxisome trajectories with 70 second episodes before, during and after myosin-Vb recruitment. f, Frame-to-frame displacements of peroxisomes. Red: 9 trajectory average. g, Peroxisome distribution in primary hippocampal neuron expressing PEX-LOV and MYO-PDZ. Dashed red rectangle was illuminated. h, 30s maximum projections of regions from (g). Arrowheads mark peroxisomes in spines. See Video S6. i, Spine targeting in control (n=12) and illuminated (n=17) dendrites, in N=3 independent experiments. Mean±SEM, *** p<0.0001, Mann-Whitney test. j, Spine entries over time. Mean±SEM, * p<0.05, *** p<0.0001, Kruskal-Wallis ANOVA, Dunn’s post-hoc test, n = 17 dendrites. Inset: Entry probability after illumination (red) fitted with exponential decay exp(t λ-1) (black, λ=36.36s). Scale bars, 5μm, except c, 10μm.
Figure 3
Figure 3. Motor-based redistribution of recycling endosomes modulates axon outgrowth.
a, d, Assay and constructs. Rapalog targets FRB-LOV to the Rab11 N-terminus. b, c, e, f, Growth cone dynamics of neurons expressing FKBP-RAB11 and BICDN-PDZ (b,c) or KIF-PDZ (e,f) without (b,e) or with FRB-LOV (c,f). See Video S7. g, h, Light-induced reduction of growth cone dynamics (g) or light-induced growth enhancement (h). Dynein/Kinesin: -FRB-LOV: n=21/19 axons, +FRB-LOV: n=25/35 axons, in N=5/5 independent experiments. Mean±SEM, * p<0.05, *** p<0.0001, unpaired two-tailed t-test. i, Same growth cone in low and high contrast illustrating reversibility of reduced Rab11 targeting and growth cone dynamics. j, Area over time for the example shown in (i). Scale bars in b, c, e, f and i are 10μm.
Figure 4
Figure 4. Altering mitochondrial dynamics through recruitment of motors and anchors.
a, b, Assay and constructs. c, Axonal mitochondria before and during KIF-PDZ recruitment. Arrowheads track individual mitochondria. See Video S8. d, Kymograph for axon shown in (c), representative for n=6 axons. Blue box marks activation (1´:15´´). e, Correlation over time for region shown in (c). f, Axonal mitochondria before and during local illumination (blue box). See Video S13. g, Relative fluorescence intensity versus time in the illuminated and the adjacent, distal region. h, Axonal mitochondria before and during SNPH recruitment. Arrowheads track individual mitochondria. See Video S9. i, Kymograph for axon shown in (h), representative for n=5 axons. Blue boxes marks activation (4´:50´´). j, Correlation versus time for region in Video S9. Scale bars, 5μm, except d and i, 10μm.

Comment in

References

    1. Vale RD. The molecular motor toolbox for intracellular transport. Cell. 2003;112:467–480. - PubMed
    1. Sheng ZH, Cai Q. Mitochondrial transport in neurons: impact on synaptic homeostasis and neurodegeneration. Nat Rev Neurosci. 2012;13:77–93. - PMC - PubMed
    1. Korolchuk VI, et al. Lysosomal positioning coordinates cellular nutrient responses. Nat Cell Biol. 2011;13:453–460. - PMC - PubMed
    1. Yadav S, Linstedt AD. Golgi positioning. Cold Spring Harbor perspectives in biology. 2011;3 - PMC - PubMed
    1. Sadowski L, Pilecka I, Miaczynska M. Signaling from endosomes: location makes a difference. Exp Cell Res. 2009;315:1601–1609. - PubMed

Publication types

MeSH terms