. 2014 Dec 31;16(1):788-804.
doi: 10.3390/ijms16010788.

Improvement of the fluorescence intensity during a flow cytometric analysis for rice protoplasts by localization of a green fluorescent protein into chloroplasts

Affiliations

Improvement of the fluorescence intensity during a flow cytometric analysis for rice protoplasts by localization of a green fluorescent protein into chloroplasts

Min Kyoung You et al. Int J Mol Sci. .

Abstract

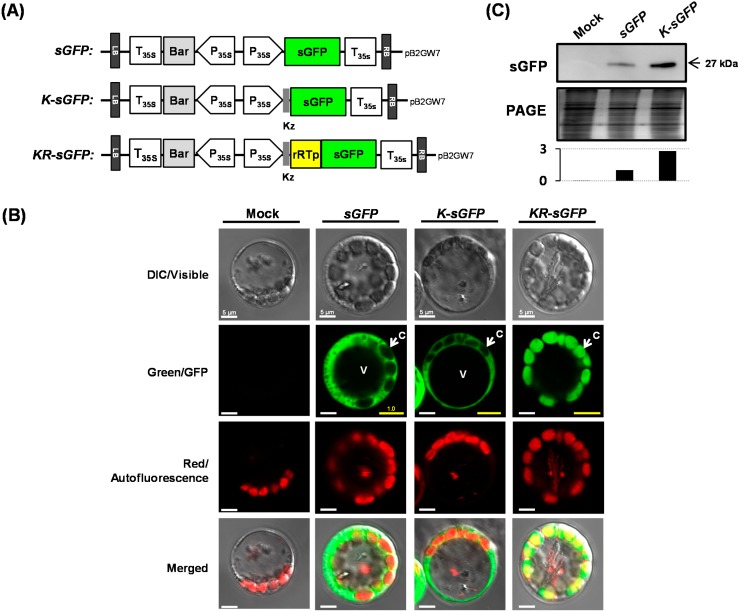
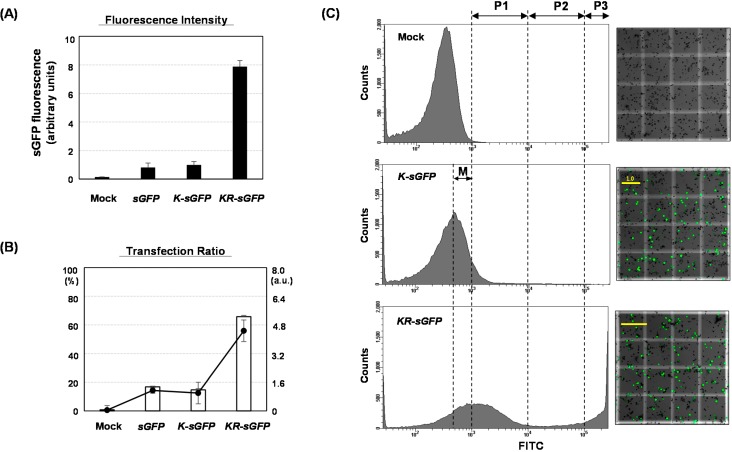
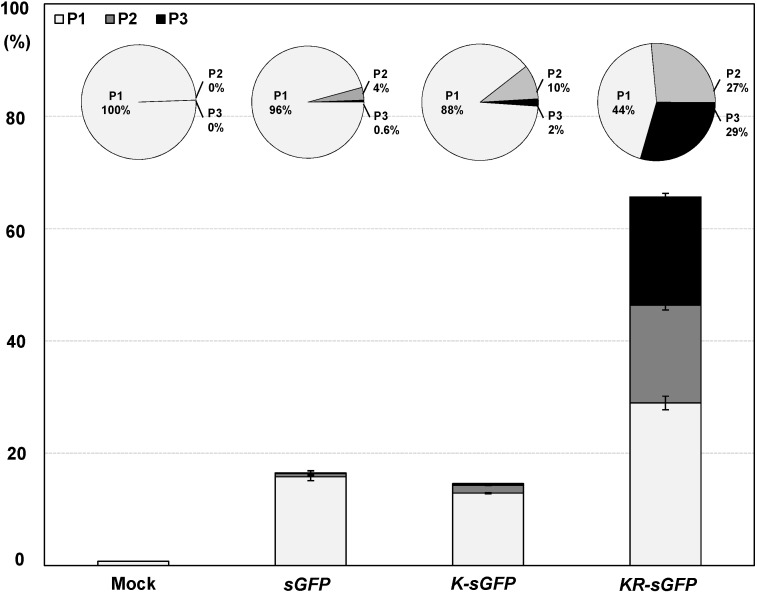
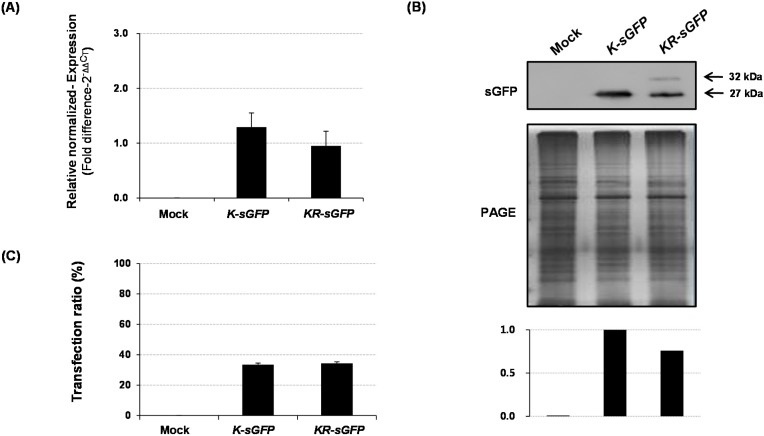
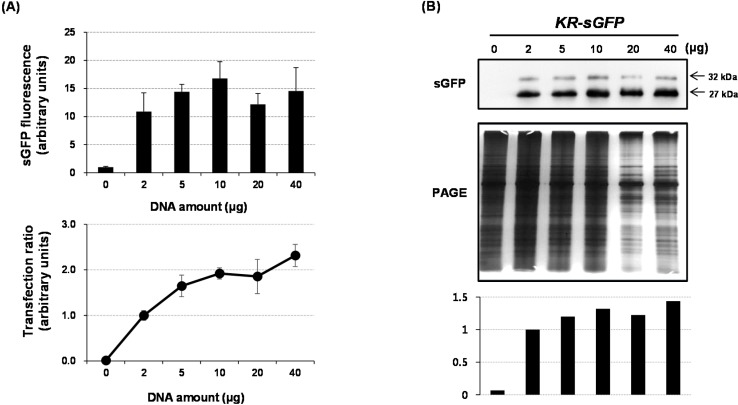
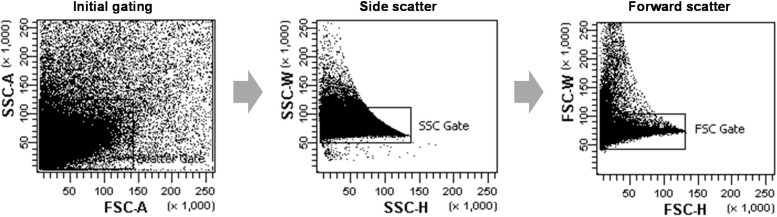
Protoplasts have been a useful unicellular system for various molecular biological analyses based on transient expression and single cell analysis using fluorescence-activated cell sorting (FACS), widely used as a powerful method in functional genomics. Despite the versatility of these methods, some limits based on low fluorescence intensity of a flow cytometric analysis (FCA) using protoplasts have been reported. In this study, the chloroplast targeting of fluorescent proteins (FPs) led to an eight-fold increase in fluorescence intensity and a 4.5-fold increase of transfection ratio from 14.7% to 65.7% as compared with their targeting into the cytoplasm. Moreover, the plot data of FCA shows that 83.3% of the K-sGFP population is under the threshold level, regarded as a non-transgenic population with background signals, while 65.7% of the K-sGFP population is spread on overall intervals. To investigate the reason underlying this finding, mRNA/protein levels and transfection efficiency were analyzed, and results suggest that mRNA/protein levels and transfection ratio are not much different between K-sGFP and KR-sGFP. From those results, we hypothesized that the difference of fluorescence intensity is not only derived from cellular events such as molecular level or transfection efficiency. Taken together, we suggest that the translocation of FPs into chloroplasts contributes to the improvement of fluorescence intensity in FCA and, apparently, plays an important role in minimizing the loss of the transfected population. Our study could be usefully applicable for highly sensitive FACS and FCA-investigations of green tissue.


Figures

Figure 1
Figure 1
Subcellular localization and expression efficiency of sGFPs in rice protoplasts. (A) Three kinds of sGFP chimera were cloned into a pB2GW7 vector to construct sGFP, K-sGFP, and KR-sGFP for use in PEG-mediated transfection into rice protoplasts. Kz: Kozak sequence; rRTp: a transit peptide of rice RuBisCo small subunit; (B) Individual and merged images of GFP, chlorophyll autofluorescence, and visible protoplasts. C: chloroplast; V: vacuole. The images were acquired at 630× magnification using a confocal microscope. The yellow signals are the merged image of the green fluorescent signals from the sGFP proteins; the red fluorescent signals from chlorophyll in the chloroplasts. The PEG-transformed protoplasts with no plasmid were used as a mock sample. The yellow scale bars on the images show the mean intensity ratio of the green fluorescence signals (for 105 pixels), analyzed by a Histogram tool, and the white scale bars mean 5 μm and (C) The expression efficiency of proteins was compared using western blot analysis. Polyclonal rabbit antibody against sGFP was used at a titer of 1:5000 and the image of PAGE gel was used to show relative quantities of the loaded proteins. The graph shows the relative band intensities that were quantified using LAS4000 software.
Figure 2
Figure 2
Comparative analysis of FCA using rice protoplasts among sGFP, K-sGFP and KR-sGFP constructs. Rice protoplasts were transfected with 5 μg plasmids of sGFP, K-sGFP, and KR-sGFP constructs. The FCAs were performed using single live cells gated by the side/forward scattering. (A) The fluorescence intensities were analyzed using the fluorescein isothiocyanate (FITC-A) channel of the flow cytometer and normalized by the average fluorescence intensity of the K-sGFP construct. The results are presented in arbitrary units; (B) The ratio of protoplasts with a fluorescence intensity exceeding the threshold value (103) to the gated protoplasts was calculated on FCA. The left axis shows the percentage of the transfected protoplasts expressing sGFP and the right axis shows their arbitrary results. The error bars show the SEM (standard error of the mean) for the data acquired from three independent transfections. Mock samples were prepared by PEG-transfection with no plasmid DNA and (C) Flow cytometry histograms (left panels) and the images of hemocytometer measurements (right panels). The fluorescence intensity on FITC was partitioned into P1 (103–104), P2 (104–105), and P3 (>105) subpopulations, and M means “the missing population”. For a hemocytometer analysis, 10 μL of the transformed protoplasts was mounted on a hemocytometer, and were photographed using the DIC and FITC-A channels of a confocal microscope (200× magnification). The merged images of one square (1 mm2) on the hemocytometer were shown. The sGFP-expressing cells were identified as the green fluorescent signals, and the yellow scale bars on the images show the mean intensity ratio (for 106 pixels) of the green fluorescence, analyzed by a Histogram tool.
Figure 3
Figure 3
The relative proportional subpopulation distribution of protoplast expressing sGFP. The fluorescence intensity was partitioned into P1, P2, and P3 subpopulations (P1: 103–104; P2: 104–105; P3: >105). The total percentage of protoplasts expressing sGFP on FCA is shown by the sum of percentages of transfected cells on each subpopulation. The circular charts above each bar graph show the ratio of transfected cells on each subpopulation. The transfected protoplast proportion of each subpopulations relative to all transfected protoplasts with a fluorescence intensity exceeding a threshold value (103) was calculated on FCA. The error bars show the SEM (standard error of the mean) for the data acquired from three independent transfections. Mock samples were prepared by PEG-transfection with no plasmid DNA.
Figure 4
Figure 4
Comparison of K-sGFP and KR-sGFP constructs based on non-FCA analysis. (A) The mRNA transcripts of sGFP and rRTp-sGFP were compared using real-time PCR. The rice ubiquitin gene was used as an internal reference for quantitative normalization; (B) The expression efficiency of proteins compared by western blot analysis. Polyclonal rabbit antibody against sGFP was used at a titer of 1:5000 and the image of PAGE gel was used to show relative quantities of the loaded proteins. The graph shows the relative band intensities quantified using LAS4000 software and (C) The ratio of protoplast cells expressing sGFP proteins was analyzed by hemocytometer measurements. A volume of 10 μL of the transformed protoplasts was mounted on a hemocytometer and the images were obtained using the DIC and FITC-A channels of a confocal microscope (200× magnification). The sGFP-expressing cells were identified as the green fluorescent signals. The error bars show the SEM of data acquired from three independent transfections. Control samples were prepared by PEG transfection with no plasmid DNA.
Figure 5
Figure 5
Optimization of the amount of DNA for FCA-based analysis using a KR-sGFP reporter system. The fluorescent signals exceeding the gating threshold were detected in single live protoplasts. (A) The sGFP fluorescence was detected using the FITC-A channel of the flow cytometer and its values were normalized by the fluorescent intensity of the protoplasts transfected using 0 μg DNA. The results are presented in arbitrary units. The transfection ratio was calculated by the proportion of transfected protoplasts relative to total protoplasts gated by side scattering and forward scattering procedure on FCA. The transfected protoplasts are determined by their fluorescence intensity exceeding the threshold value (103) on FCA; The results are normalized by transfection ratio of the protoplasts transfected using 2 μg DNA and presented in arbitrary units and (B) The expression efficiency of proteins was compared using western blot analysis. Polyclonal rabbit antibody against sGFP was used at a titer of 1:5000 and the image of PAGE gel was used to show relative quantities of the loaded proteins. The graph shows the relative band intensities quantified using LAS4000 software.
Figure 6
Figure 6
The scatter plots of representative data from FCA of rice protoplasts. The protoplast populations were initially gated through a forward scatter (FSC) area versus a side scatter (SSC) area to exclude non-single cells such as cell-multiplets or cell debris. Afterwards, further gates were performed using a SSC-height vs. SSC-width dot plot and a FSC-height vs. FSC-width to more strictly select single protoplast cells.

Similar articles

Cited by

References

    1. Faraco M., di Sansebastiano G.P., Spelt K., Koes R.E., Quattrocchio F.M. One protoplast is not the other! Plant Physiol. 2011;156:474–478. doi: 10.1104/pp.111.173708. - DOI - PMC - PubMed
    1. Bargmann B.O., Birnbaum K.D. Fluorescence activated cell sorting of plant protoplasts. J. Vis. Exp. 2010;36:1673. - PMC - PubMed
    1. Borges F., Gardner R., Lopes T., Calarco J.P., Boavida L.C., Slotkin R.K., Martienssen R.A., Becker J.D. Facs-based purification of arabidopsis microspores, sperm cells and vegetative nuclei. Plant Methods. 2012;8:44. doi: 10.1186/1746-4811-8-44. - DOI - PMC - PubMed
    1. Borges F., Gomes G., Gardner R., Moreno N., McCormick S., Feijo J.A., Becker J.D. Comparative transcriptomics of arabidopsis sperm cells. Plant Physiol. 2008;148:1168–1181. doi: 10.1104/pp.108.125229. - DOI - PMC - PubMed
    1. Nawy T., Lee J.Y., Colinas J., Wang J.Y., Thongrod S.C., Malamy J.E., Birnbaum K., Benfey P.N. Transcriptional profile of the arabidopsis root quiescent center. Plant Cell. 2005;17:1908–1925. doi: 10.1105/tpc.105.031724. - DOI - PMC - PubMed

Publication types

MeSH terms

LinkOut - more resources