. 2015 Jan 1;29(1):63-80.
doi: 10.1101/gad.247361.114.

Detained introns are a novel, widespread class of post-transcriptionally spliced introns

Affiliations

Detained introns are a novel, widespread class of post-transcriptionally spliced introns

Paul L Boutz et al. Genes Dev. .

Abstract

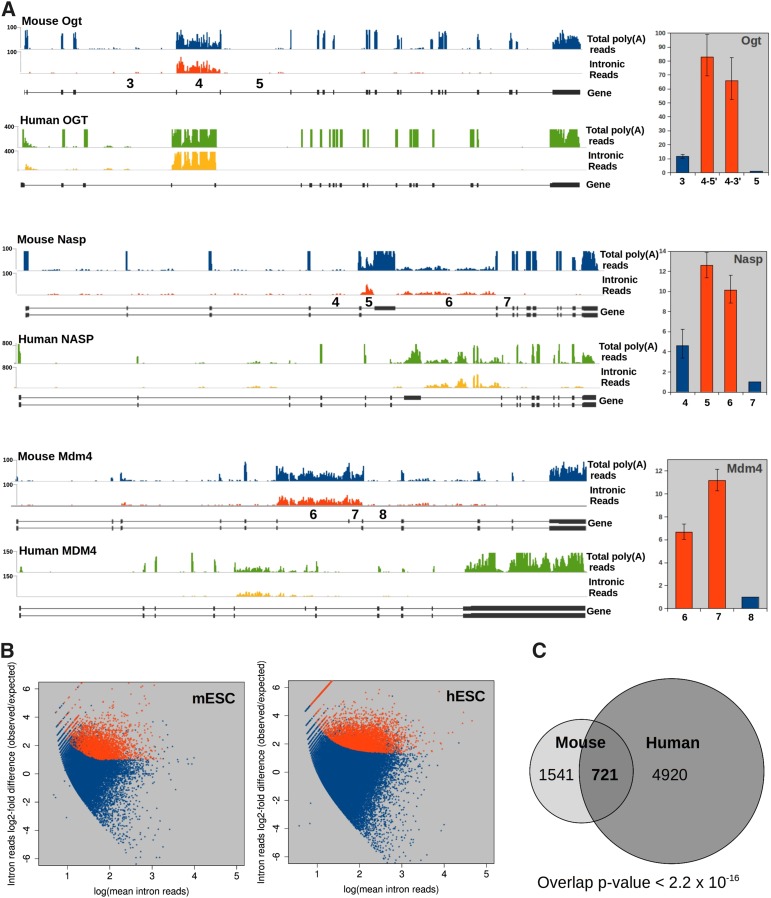
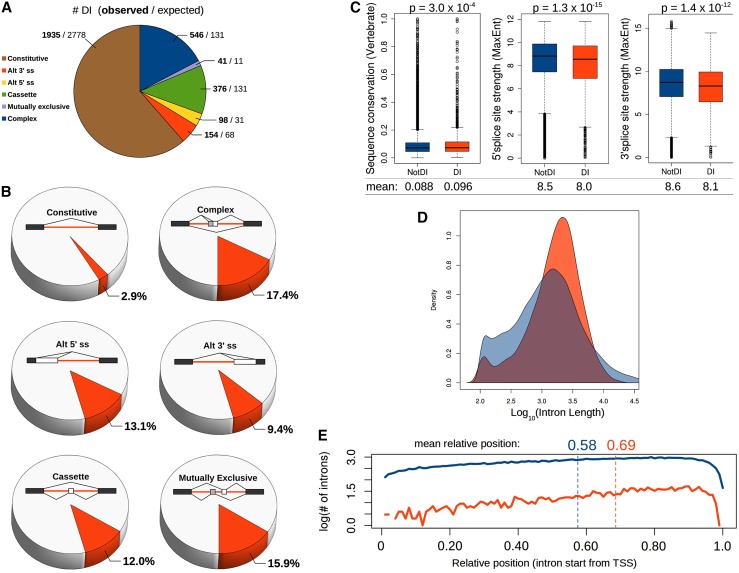
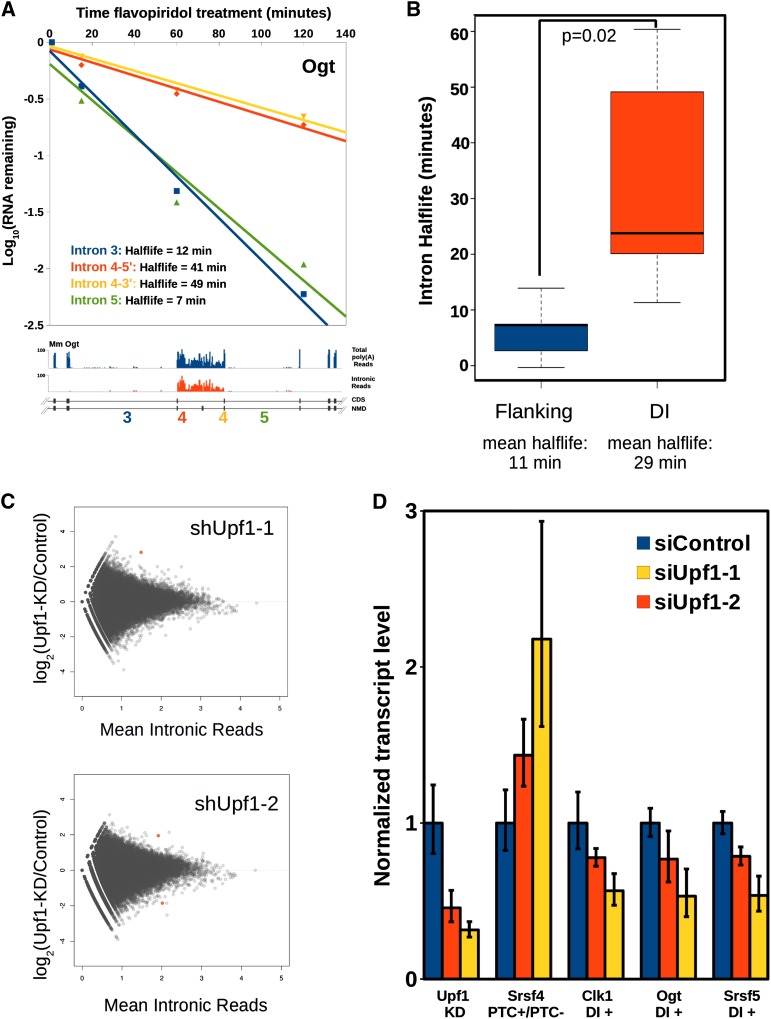
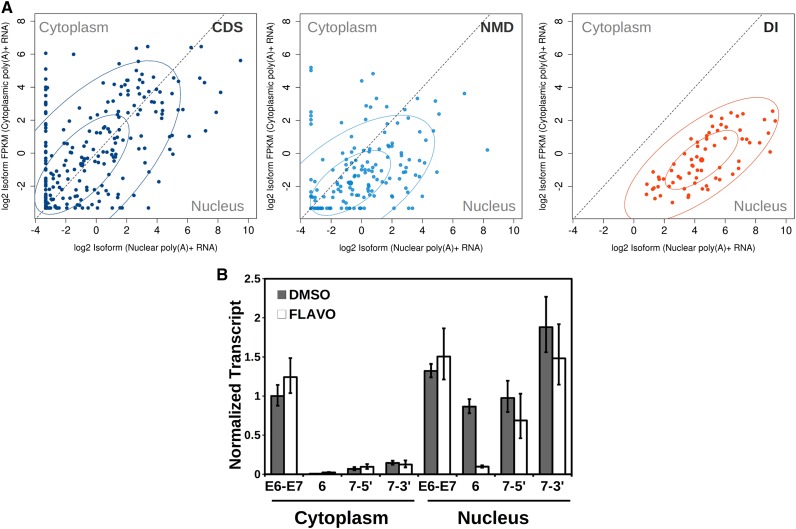
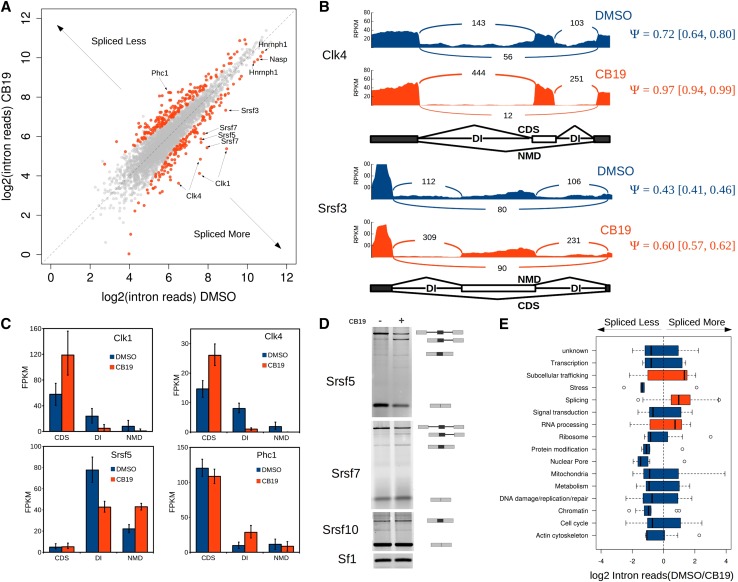
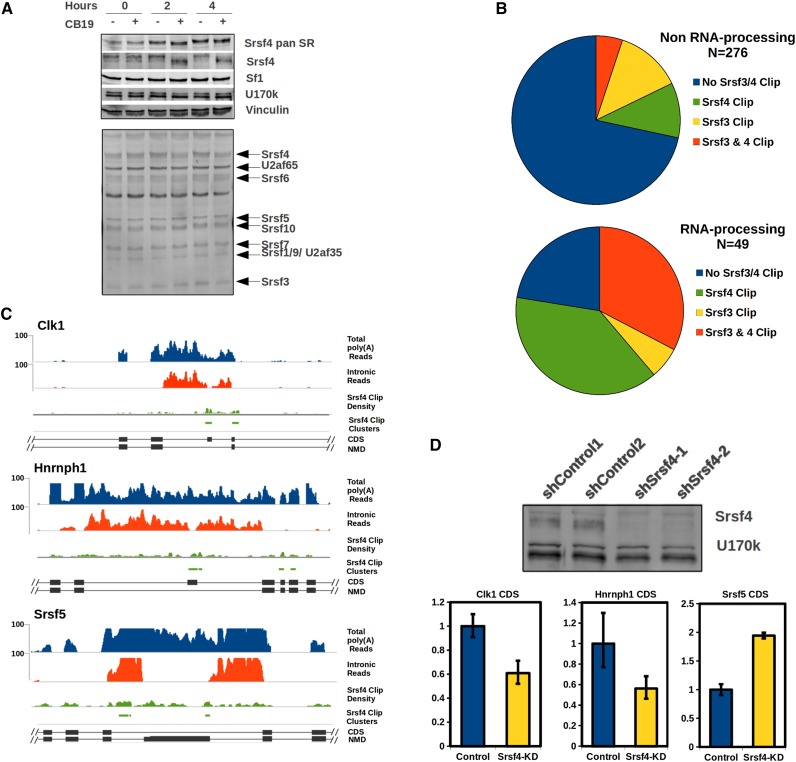
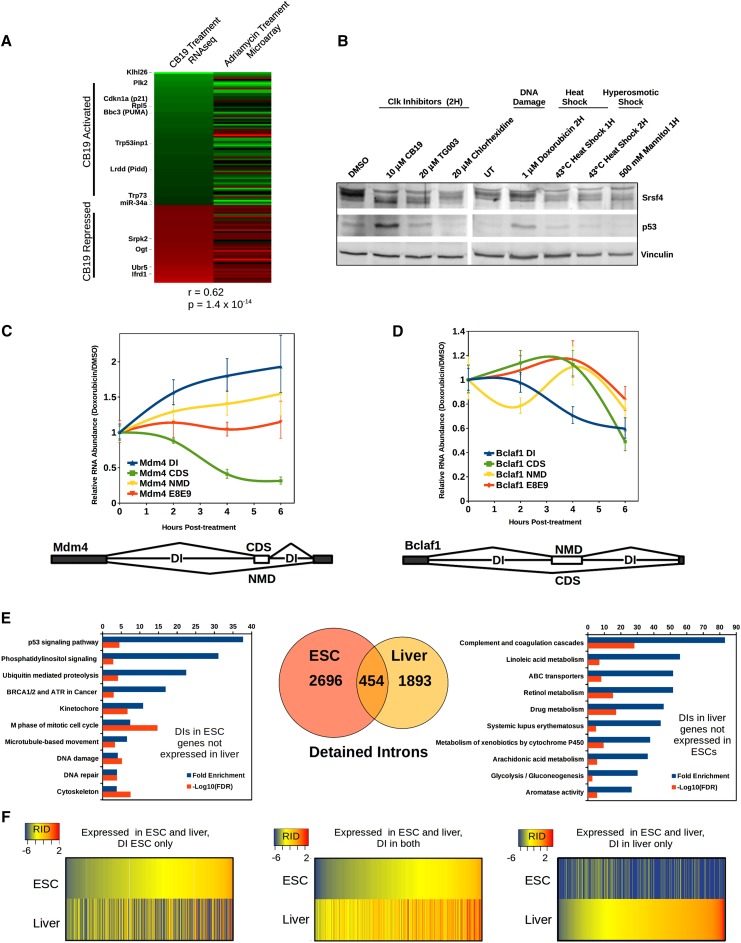
Deep sequencing of embryonic stem cell RNA revealed many specific internal introns that are significantly more abundant than the other introns within polyadenylated transcripts; we classified these as "detained" introns (DIs). We identified thousands of DIs, many of which are evolutionarily conserved, in human and mouse cell lines as well as the adult mouse liver. DIs can have half-lives of over an hour yet remain in the nucleus and are not subject to nonsense-mediated decay (NMD). Drug inhibition of Clk, a stress-responsive kinase, triggered rapid splicing changes for a specific subset of DIs; half showed increased splicing, and half showed increased intron detention, altering transcript pools of >300 genes. Srsf4, which undergoes a dramatic phosphorylation shift in response to Clk kinase inhibition, regulates the splicing of some DIs, particularly in genes encoding RNA processing and splicing factors. The splicing of some DIs-including those in Mdm4, a negative regulator of p53-was also altered following DNA damage. After 4 h of Clk inhibition, the expression of >400 genes changed significantly, and almost one-third of these are p53 transcriptional targets. These data suggest a widespread mechanism by which the rate of splicing of DIs contributes to the level of gene expression.

Keywords: Clk kinase; detained introns; post-transcriptional splicing.


Figures

Figure 1.
Figure 1.
Mouse and human poly(A)+ RNA contain an enriched subset of introns. (A) Total mapped read densities from poly(A)+ RNA-seq libraries from mESCs (blue tracks) or hESCs (green tracks) and the same data sets with exonic reads subtracted (intronic reads; red in mESCs and yellow in hESCs). Positions of exons are shown below (gene). Intron numbers for mESC introns assayed by qRT–PCR are shown above the gene schematic. (Right panels) qRT–PCR of high-coverage introns shown in red, normalized to the downstream flanking intron (mean n = 3–6 ± SEM). (B) Quantification of introns in mESC and hESC poly(A) RNA-seq. Introns with a greater than twofold ratio of observed/expected read count, FDR < 0.01, are shown in red; all other expressed introns are in blue. (C) Overlap of introns showing statistically significant high coverage in mice and humans for which an orthologous relationship could be determined. P-value was determined by two-sided hypergeometric. See also Supplemental Figure S1 and Supplemental Data S1 and S2.
Figure 2.
Figure 2.
Detained introns are found in a minority of all types of splicing events and exhibit distinct structural properties. (A) Number of DIs within each class of constitutive/alternative splicing in mESCs. The first number in bold is the observed number of DIs per class, and the second number indicates how many of each class would be expected if DIs were randomly distributed among all introns. (B) For each class of constitutive and alternative splicing in mESCs, the percentage of events in each class in which the regulated exon is directly flanked by a DI is represented in red. A schematic for each class is shown with constitutive exons in black, alternative exons in white or gray, DIs in red, and splicing patterns indicated by lines connecting splice sites. (C) Comparison among all constitutively spliced introns expressed in mESCs between non-DI (blue) and DI (red) subsets for vertebrate conservation and 5′ and 3′ splice site strength determined by MaxEnt (Yeo and Burge 2004) (indicated on the Y-axes). P-values indicate a significant difference between the two population means (Welch’s t-test), shown below the box plots. Whiskers indicate 1.5× interquartile range. (D) Kernel density plot of the length distribution of constitutive non-DIs (blue) compared with DIs (red). DIs have a slightly longer median length (1789 compared with 1251 for non-DIs) but a shorter average length (2277 compared with 2930 for non-DIs). (E) Relative positions of the 5′ ends of constitutive DIs (red) and constitutive non-DIs (blue) within the gene. The mean relative position for the group is indicated above. See also Supplemental Figure S2 and Supplemental Table S1.
Figure 3.
Figure 3.
Detained introns have longer half-lives than other introns and are not NMD substrates. (A) Half-lives of DIs and flanking introns from Ogt determined by treating mESCs with 1 μM flavopiridol and harvesting total RNA at the indicated time points followed by qRT–PCR with the indicated primer sets; data were averaged from three independent experiments. Primer sets at both the 5′ (red) and 3′ (yellow) exon–intron junctions of intron 4 were used, and the measured half-lives are indicated for each intron assayed. (B) Half-lives for six detained and nine flanking introns were estimated from flavopiridol time courses as in A, and the population mean half-life was calculated. Whiskers indicate 1.5× interquartile range. (C) Log2 fold change in intron reads between control and Upf1 knockdowns in mESCs calculated from poly(A)+ RNA-seq data (Hurt et al. 2013) for all expressed introns (blue). Introns showing significant change with an adjusted P-value < 0.05 are indicated in red. (D) RNA from mESCs treated with one of two independent siRNAs targeting Upf1 or a control siRNA was assayed by qRT–PCR for the indicated transcripts and normalized to the control siRNA treatment (mean n = 3 ± SEM).
Figure 4.
Figure 4.
Detained intron-containing transcripts are localized in the nucleus and constitute a separate population from NMD substrates. (A) Nuclear and cytoplasmic poly(A)+ RNA-seq reads from HeLa cells, HepG2 cells, and HUVECs (The ENCODE Project Consortium 2012) were assigned to transcripts classified as CDS (dark blue), NMD substrates (NMD; light blue), or DI-containing substrate (DI; red) for 33 genes, and FPKMs were determined for each variant in each compartment. Fifty percent and 95% concentration ellipses are shown for each class. (B) mESCs were treated with either DMSO (black bars) or flavopiridol (white bars) for 30 min and then fractionated into nucleus and cytoplasm. Relative RNA levels for each intron (6, 7-5′, and 7-3′) or exon–exon (E6–E7) junction were measured by qRT–PCR and normalized to give cell equivalents (mean of two independent fractionations ± SEM). See also Supplemental Figure S3, Supplemental Table S2, and Supplemental Data S3.
Figure 5.
Figure 5.
Inhibition of Clk kinase alters splicing of a subset of DIs. (A) Hundreds of DIs are differentially spliced in response to Clk kinase inhibitor. The scatter plot shows the log2 of the intron read density for each intron after 2 h in DMSO (X-axis) versus CB19 (Y-axis). Introns changing significantly (P < 0.05) in either direction are plotted in red, and nonresponsive introns are in gray. Introns chosen for further analysis are labeled. (B) Sashimi plots showing read density and number of splice junctions, with the percentage of spliced-in (Ψ) values determined by MISO (Katz et al. 2010) indicated in red or blue numbers at the right of the plots (±95% confidence intervals in square brackets) for cassette exons in Clk4 and Srsf3 upon CB19 treatment in DMSO control (blue) compared with CB19 treatment (red). Schematics indicating the isoform produced by splice variants are shown below. (C) FPKMs determined by Cufflinks (Trapnell et al. 2010) for summed isoforms classified as CDS, NMD, or DI-containing are plotted for each gene after 2 h of treatment with DMSO (blue bars) or CB19 (orange bars). Error bars indicate ±95% confidence intervals. (D) RT–PCR products from mESCs treated with DMSO or CB19 for 2 h. Splice products and intermediates are indicated by the schematics at the right. Srsf10 shows no response to CB19, and Sf1 served as a loading control. (E) All genes containing CB19-responsive DIs were divided into functional categories, and the distribution of the log2 fold change in splicing is indicated. Categories in blue have a median direction of “spliced less,” while those in orange have a median direction “spliced more.” Whiskers indicate 1.5× interquartile range. See also Supplemental Figures S4 and S5.
Figure 6.
Figure 6.
Srsf4 is a major Clk kinase substrate, and Srsf3/4 Clip tags are prevalent among CB19-sensitive RNA processing gene DIs. (A) Srsf4 is the predominant SR protein dephosphorylated in mESCs upon Clk kinase inhibition. Western blots of mESC total cell lysate (+phosphatase inhibitors) treated with DMSO or CB19 for 0, 2, or 4 h. Antibodies used to blot (from the top down) were α-pan SR protein, α-Srsf4, α-Sf1, α-U170k, and α-vinculin. (Bottom panel) α-Phospho-SR protein (1H4). (B) Srsf3 and Srsf4 Clip clusters were overlapped with DIs that respond to CB19, and the corresponding genes were divided into non-RNA processing (top pie chart) and RNA processing (bottom chart). (C) Total read density (top) and intron read density (bottom) are shown for 2-h DMSO-treated (blue) and CB19-treated (red) cells; Srsf4 Clip density and Clip clusters are shown in green across the NMD switch exon regions flanked by DIs in the Clk1, Hnrnph1, and Srsf5 genes. (D) Western blot showing Srsf4 knockdowns blotted with α-Srsf4; α-U170k was used as a loading control. RNA from lentivirus-infected mESCs was assayed for splicing of Clk1, Hnrnph1, and Srsf5 coding variants. Combined control shRNA mean (n = 4–6 ± SEM) are shown in blue, and that of the combined shRNAs targeting Srsf4 are shown in yellow for each transcript.
Figure 7.
Figure 7.
DIs are differentially spliced in response to DNA damage and show cell type-dependent abundance. (A) Genes showing significant change in expression at 4-h after CB19 treatment were compared with mESC p53 targets responding to Adriamycin (doxorubicin) treatment (Li et al. 2012). Genes going up in expression are colored green, and those going down are in red. Correlation was determined by Wilcoxon rank sum. (B) Western blot of Srsf4 (top panels) to indicate Clk kinase activity and of p53 protein (middle panel) and vinculin loading control (bottom panel) with various Clk inhibitors or stress conditions as indicated. (C,D) Real-time qRT–PCR was performed on RNA from doxorubicin-treated cells or DMSO-treated cells. All transcript-specific signals were first normalized to Mylpf transcript levels and then normalized to the signal at time 0. The plot shows the ratio of DIs relative to the total transcript level of each gene in doxorubicin compared with DMSO and the relative change in spliced isoform levels of each gene of the NMD substrate (NMD), CDS, and total transcript in Mdm4 (C) and Bclaf1 (D). Bars represent the average, and error bars are SEM; n = 3. Schematics indicating the structure of the NMD switch exons and flanking DIs are shown below. (E, middle) DIs in genes expressed in either mESCs or adult mouse liver samples or both (Venn diagram). DAVID GO analysis of genes expressed only in mESCs (left) or livers (right) that contain DIs are shown with fold enrichment and the −log10 of the FDR for each category graphed. (F) Relative intron detention (RID) levels for all introns expressed in both mESCs and livers. (Left) RID for introns found in genes expressed in both cell types but only detained in mESCs and not livers. (Right) Introns detained only in livers but not mESCs. (Middle) Introns detained in both cell types. See also Supplemental Figs. S6 and S7.

References

    1. Allende-Vega N, Dayal S, Agarwala U, Sparks A, Bourdon JC, Saville MK. 2013. p53 is activated in response to disruption of the pre-mRNA splicing machinery. Oncogene 32: 1–14. - PubMed
    1. Ameur A, Zaghlool A, Halvardson J, Wetterbom A, Gyllensten U, Cavelier L, Feuk L. 2011. Total RNA sequencing reveals nascent transcription and widespread co-transcriptional splicing in the human brain. Nat Struct Mol Biol 18: 1435–1440. - PubMed
    1. Anders S, Huber W. 2010. Differential expression analysis for sequence count data. Genome Biol 11: R106. - PMC - PubMed
    1. Anko ML, Muller-McNicoll M, Brandl H, Curk T, Gorup C, Henry I, Ule J, Neugebauer KM. 2012. The RNA-binding landscapes of two SR proteins reveal unique functions and binding to diverse RNA classes. Genome Biol 13: R17. - PMC - PubMed
    1. Aubol BE, Plocinik RM, Hagopian JC, Ma CT, McGlone ML, Bandyopadhyay R, Fu XD, Adams JA. 2013. Partitioning RS domain phosphorylation in an SR protein through the CLK and SRPK protein kinases. J Mol Biol 425: 2894–2909. - PMC - PubMed

Publication types