. 2015 Jan 20;112(3):851-6.
doi: 10.1073/pnas.1320611111. Epub 2015 Jan 5.

Single cell-derived clonal analysis of human glioblastoma links functional and genomic heterogeneity

Affiliations

Single cell-derived clonal analysis of human glioblastoma links functional and genomic heterogeneity

Mona Meyer et al. Proc Natl Acad Sci U S A. .

Abstract

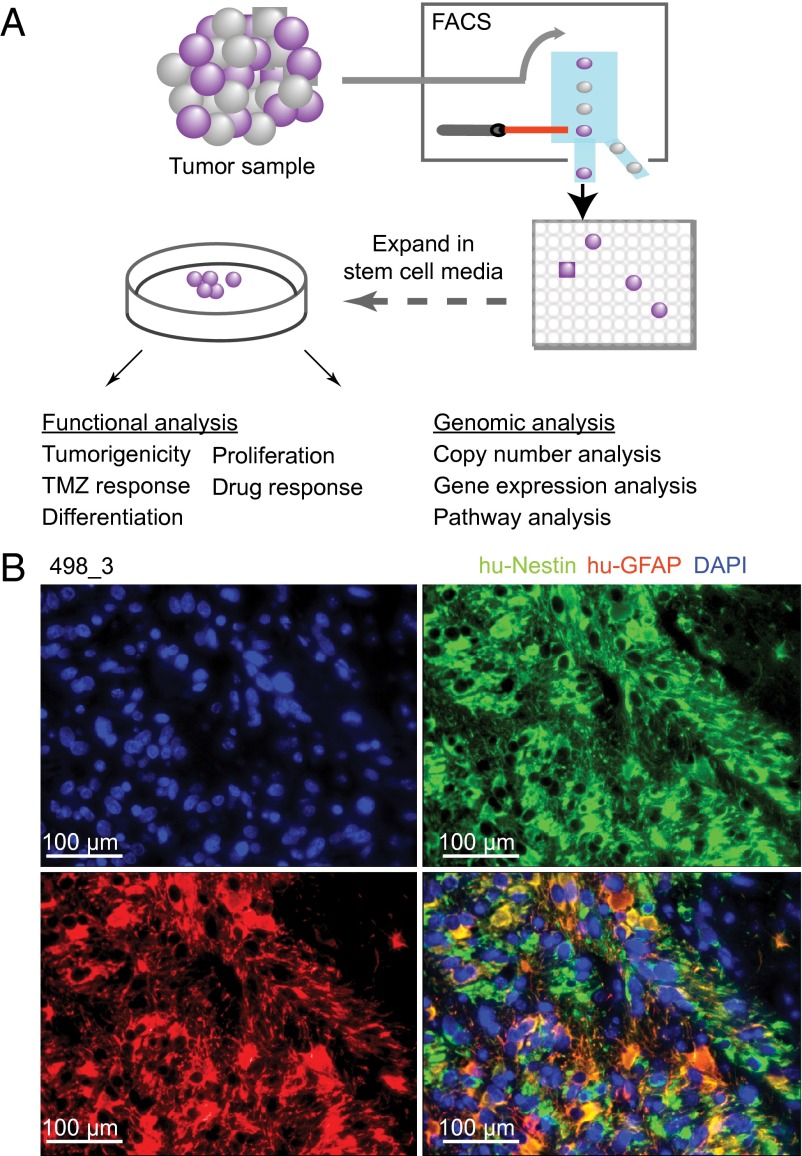
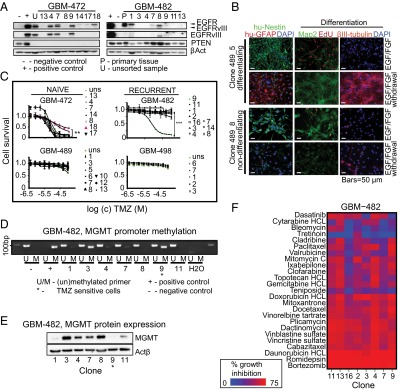
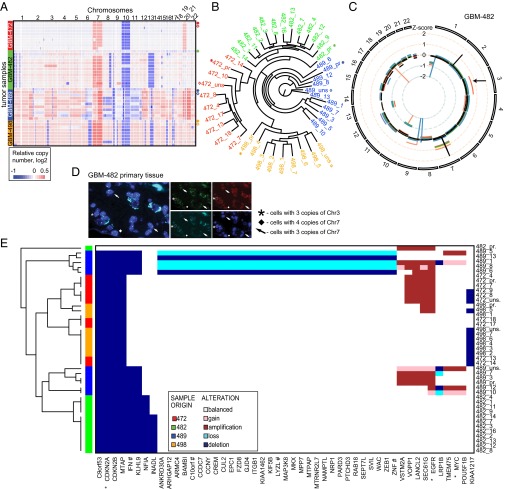
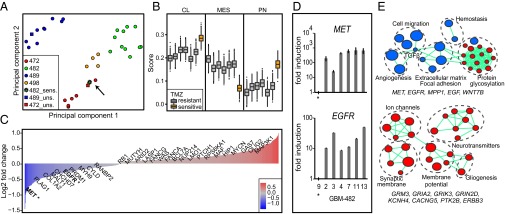
Glioblastoma (GBM) is a cancer comprised of morphologically, genetically, and phenotypically diverse cells. However, an understanding of the functional significance of intratumoral heterogeneity is lacking. We devised a method to isolate and functionally profile tumorigenic clones from patient glioblastoma samples. Individual clones demonstrated unique proliferation and differentiation abilities. Importantly, naïve patient tumors included clones that were temozolomide resistant, indicating that resistance to conventional GBM therapy can preexist in untreated tumors at a clonal level. Further, candidate therapies for resistant clones were detected with clone-specific drug screening. Genomic analyses revealed genes and pathways that associate with specific functional behavior of single clones. Our results suggest that functional clonal profiling used to identify tumorigenic and drug-resistant tumor clones will lead to the discovery of new GBM clone-specific treatment strategies.

Keywords: cancer; clonal heterogeneity; functional analysis; genomic analysis; glioblastoma.


Conflict of interest statement

The authors declare no conflict of interest.

Figures

Fig. 1.
Fig. 1.
Single cell-derived clonal cultures from primary GBMs show a neural precursor phenotype and are tumorigenic. (A) Functional characterization of single cell-derived clones. Glioblastoma samples were dissociated into single cell suspensions. Cells were then sorted using stem cell markers to enrich for clonogenic activity. Single live cells were then expanded in EGF/FGF media and analyzed functionally and genomically. (B) Immunostaining of a representative xenograft shows tumor formation with an infiltrative phenotype reminiscent of human GBM cell behavior in situ (green, human nestinl; red, human GFAP; blue, DAPI).
Fig. 2.
Fig. 2.
Individual clones within the same tumor show phenotypic heterogeneity. (A) Differential expression of EGFR, EGFRvIII, and PTEN in individual clones from two patient tumors. EGFRvIII-transfected human fetal brain cell line HF7450NS was used as control. (B) Individual clones of tumor GBM-489 vary in their ability to express markers of differentiation. Staining for human Nestin (green), human GFAP (red), Map2 (green), βIII-tubulin (red), and EdU (red). (C) Variable temozolomide (TMZ) drug responses of individual clones from four different tumors. Clones were treated once with TMZ (0.39–100 µM) and measured for viability. Significant differences in TMZ response were observed among clones from two tumors, GBM-472 (P = 0.0011), and GBM-482 (P < 10−4). (D) Heterogeneous promoter methylation of MGMT in GBM-482. Asterisks indicate sensitive cell populations. (E) Heterogeneous protein expression of MGMT in GBM-482. (F) NCI drug library screen reveals clones with variable drug sensitivity in GBM-482. Drugs with at least 50% growth inhibition on individual samples are shown and are ranked by response variability.
Fig. 3.
Fig. 3.
Heterogeneous clonal genetics as mapped by copy number (CN) analysis. (A) Probe-level CN heat map shows genetic variation in clonal populations. Samples are grouped vertically by patient tumor (left vertical color bar; right label: asterisk, primary sample; diamond, unsorted population). (B) Phylogenetic analysis confirms the common origin of derived clones (colors) and shows that primary samples (asterisks) are relatively distant from derived clones. (C) Circos plot of segmented CN alterations in GBM-482. Inner circle represents baseline (no CN change), and lines expanding toward the center or the periphery of the diagram represent CN losses or gains, respectively (primary, black; clonal, colored). (D) FISH confirms chr3 gain in primary tumor tissue of GBM-482. (E) Heat map of frequently altered genes with clonal heterogeneity (at least five alterations).
Fig. 4.
Fig. 4.
Clonal function is correlated with gene expression and pathway function. (A) Principal component analysis of gene expression profiles of 32 GBM clones and unsorted populations highlights divergence of the TMZ-sensitive clone 482_9. (B) Transcriptional analysis of GBM-482 predicts that the TMZ-sensitive clone (orange, 482_9) belongs to a different GBM subtype than the six TMZ-resistant clones (gray). Three transcriptional subtypes of GBM (classical, mesenchymal, proneural) were analyzed with bootstrapping and permutation tests. (C) Barplot shows differentially expressed genes in the TMZ-sensitive clone 482_9 compared with mean expression in six TMZ-resistant clones of tumor GBM-482 (absolute z-score > 2). Genes are ranked according to fold change. (D) qRT-PCR analysis confirms significantly lower gene expression of MET and EGFR in the TMZ-sensitive clone 482_9 compared with six TMZ-resistant clones of tumor GBM-482. (E) Pathway analysis illustrates differentially expressed pathways in the TMZ-sensitive clone with increased (red) and decreased (blue) gene expression. Selected genes associated with pathways are shown below network diagrams.

Similar articles

Cited by

References

    1. Brennan CW, et al. TCGA Research Network The somatic genomic landscape of glioblastoma. Cell. 2013;155(2):462–477. - PMC - PubMed
    1. Cancer Genome Atlas Research Network Comprehensive genomic characterization defines human glioblastoma genes and core pathways. Nature. 2008;455(7216):1061–1068. - PMC - PubMed
    1. Parsons DW, et al. An integrated genomic analysis of human glioblastoma multiforme. Science. 2008;321(5897):1807–1812. - PMC - PubMed
    1. Verhaak RG, et al. Cancer Genome Atlas Research Network Integrated genomic analysis identifies clinically relevant subtypes of glioblastoma characterized by abnormalities in PDGFRA, IDH1, EGFR, and NF1. Cancer Cell. 2010;17(1):98–110. - PMC - PubMed
    1. Noushmehr H, et al. Cancer Genome Atlas Research Network Identification of a CpG island methylator phenotype that defines a distinct subgroup of glioma. Cancer Cell. 2010;17(5):510–522. - PMC - PubMed

Publication types