

Conserving the functional and phylogenetic trees of life of European tetrapods
- PMID: 25561666
- PMCID: PMC4290419
- DOI: 10.1098/rstb.2014.0005
Conserving the functional and phylogenetic trees of life of European tetrapods
Abstract
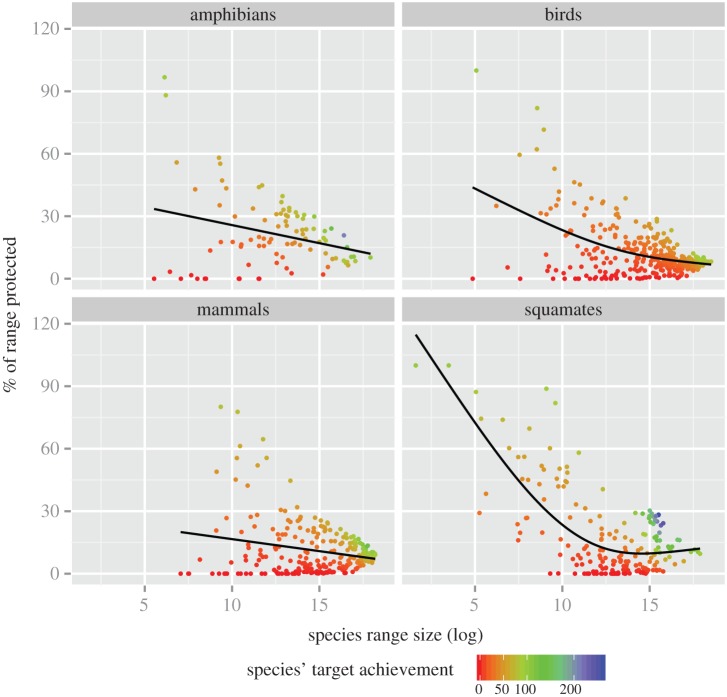
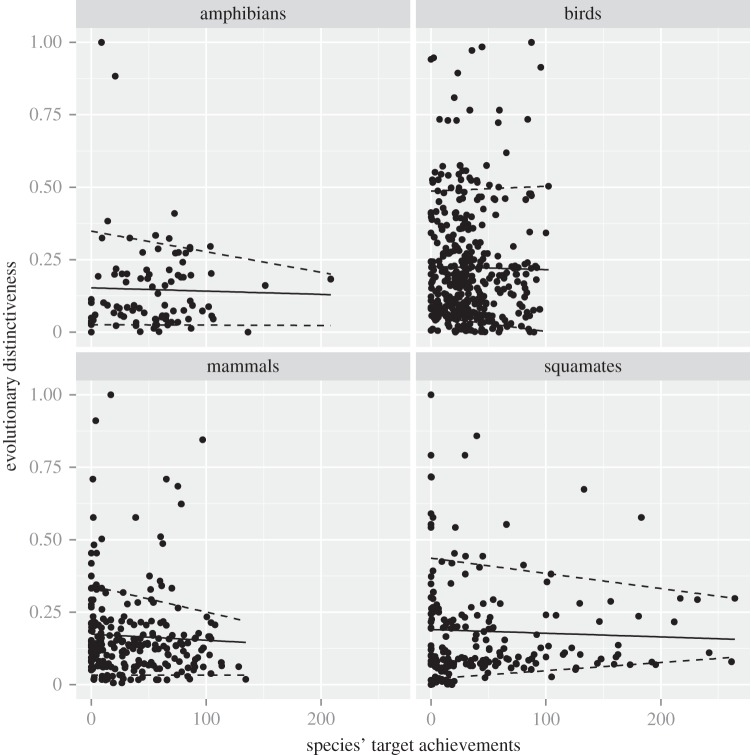
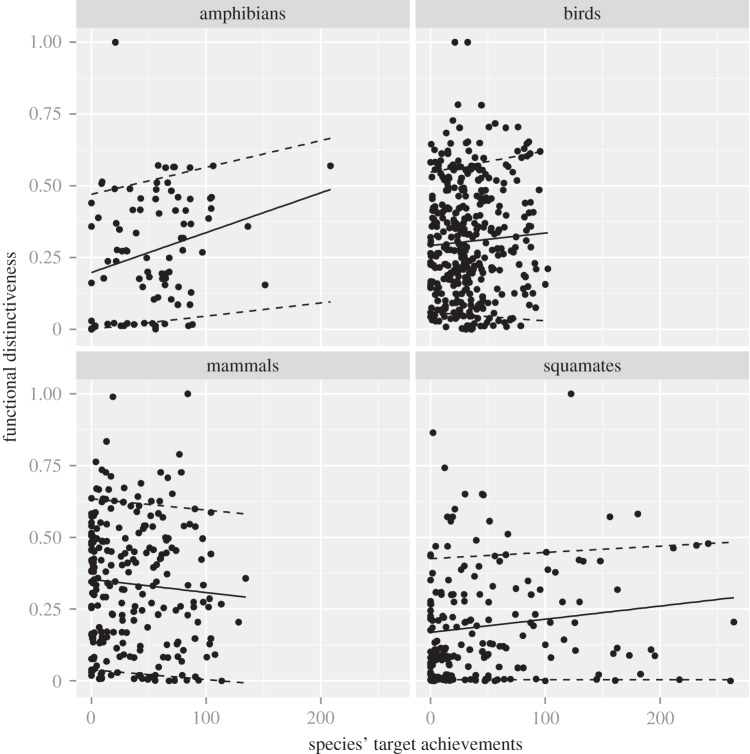
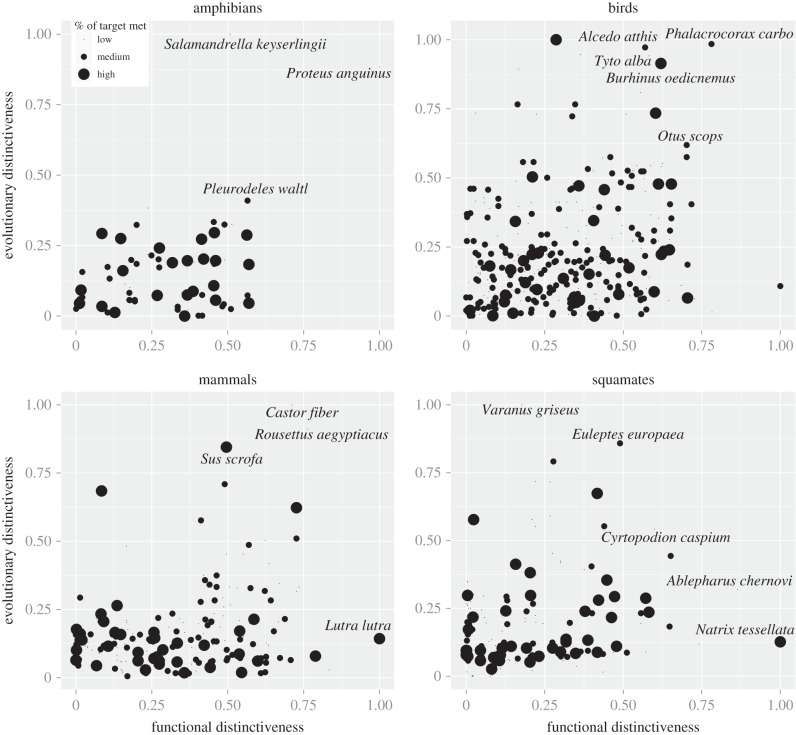
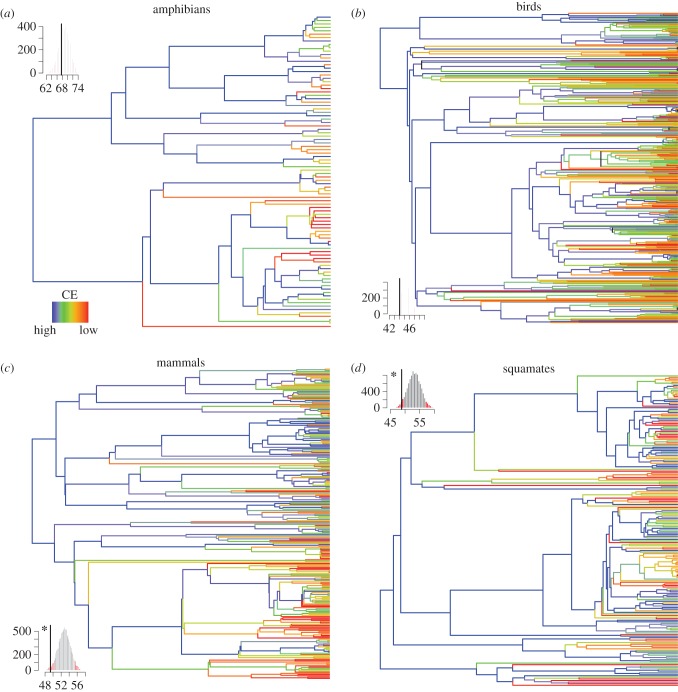
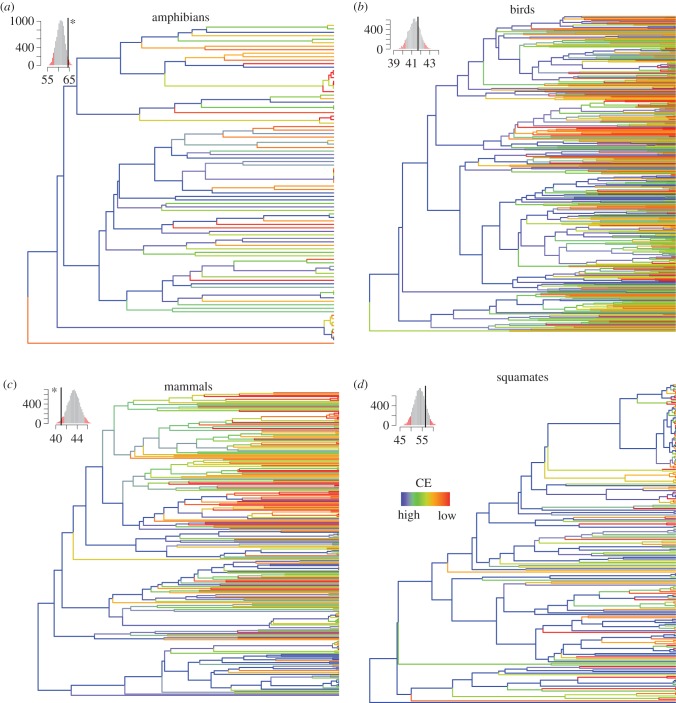
Protected areas (PAs) are pivotal tools for biodiversity conservation on the Earth. Europe has had an extensive protection system since Natura 2000 areas were created in parallel with traditional parks and reserves. However, the extent to which this system covers not only taxonomic diversity but also other biodiversity facets, such as evolutionary history and functional diversity, has never been evaluated. Using high-resolution distribution data of all European tetrapods together with dated molecular phylogenies and detailed trait information, we first tested whether the existing European protection system effectively covers all species and in particular, those with the highest evolutionary or functional distinctiveness. We then tested the ability of PAs to protect the entire tetrapod phylogenetic and functional trees of life by mapping species' target achievements along the internal branches of these two trees. We found that the current system is adequately representative in terms of the evolutionary history of amphibians while it fails for the rest. However, the most functionally distinct species were better represented than they would be under random conservation efforts. These results imply better protection of the tetrapod functional tree of life, which could help to ensure long-term functioning of the ecosystem, potentially at the expense of conserving evolutionary history.
Keywords: endemics; evolutionary distinctiveness; functional distinctiveness; gap analysis; protected areas.
Figures
Similar articles
-
Tempo and Mode of the Evolution of Venom and Poison in Tetrapods.Toxins (Basel). 2016 Jun 23;8(7):193. doi: 10.3390/toxins8070193. Toxins (Basel). 2016. PMID: 27348001 Free PMC article.
-
A multitaxonomic assessment of Natura 2000 effectiveness across European biogeographic regions.Conserv Biol. 2024 Jun;38(3):e14212. doi: 10.1111/cobi.14212. Epub 2024 Feb 11. Conserv Biol. 2024. PMID: 37904665
-
Conservation of more evolutionary unique amphibian communities in Türkiye: The role of protected areas.J Environ Manage. 2024 Sep;368:122001. doi: 10.1016/j.jenvman.2024.122001. Epub 2024 Aug 7. J Environ Manage. 2024. PMID: 39116812
-
Predicting loss of evolutionary history: Where are we?Biol Rev Camb Philos Soc. 2017 Feb;92(1):271-291. doi: 10.1111/brv.12228. Epub 2015 Oct 14. Biol Rev Camb Philos Soc. 2017. PMID: 26467982 Review.
-
A comparative overview of immunoglobulin genes and the generation of their diversity in tetrapods.Dev Comp Immunol. 2013 Jan-Feb;39(1-2):103-9. doi: 10.1016/j.dci.2012.02.008. Epub 2012 Feb 23. Dev Comp Immunol. 2013. PMID: 22366185 Review.
Cited by
-
Functional Rarity: The Ecology of Outliers.Trends Ecol Evol. 2017 May;32(5):356-367. doi: 10.1016/j.tree.2017.02.002. Epub 2017 Apr 4. Trends Ecol Evol. 2017. PMID: 28389103 Free PMC article. Review.
-
Large variability in response to future climate and land-use changes among Chinese Theaceae species.Ecol Evol. 2022 Nov 15;12(11):e9480. doi: 10.1002/ece3.9480. eCollection 2022 Nov. Ecol Evol. 2022. PMID: 36407894 Free PMC article.
-
Phylogeny, extinction and conservation: embracing uncertainties in a time of urgency.Philos Trans R Soc Lond B Biol Sci. 2015 Feb 19;370(1662):20140002. doi: 10.1098/rstb.2014.0002. Philos Trans R Soc Lond B Biol Sci. 2015. PMID: 25561663 Free PMC article.
-
Loss and conservation of evolutionary history in the Mediterranean Basin.BMC Ecol. 2016 Oct 7;16(1):43. doi: 10.1186/s12898-016-0099-3. BMC Ecol. 2016. PMID: 27717355 Free PMC article.
-
High-throughput sequencing reveals the diversity and community structure of rhizosphere fungi of Ferula Sinkiangensis at different soil depths.Sci Rep. 2019 Apr 25;9(1):6558. doi: 10.1038/s41598-019-43110-z. Sci Rep. 2019. PMID: 31024051 Free PMC article.
References
-
- Jenkins DG, Ricklefs RE. 2011. Biogeography and ecology: two views of one world. Phil. Trans. R. Soc. B 366, 2331–2335 (doi:10.1098/rstb.2011.0064) - DOI - PMC - PubMed
-
- Pompa S, Ehrlich PR, Ceballos G. 2011. Global distribution and conservation of marine mammals. Proc. Natl Acad. Sci. USA 108, 13 600–13 605 (doi:10.1073/pnas.1101525108) - DOI - PMC - PubMed
-
- Jennings MD. 2000. Gap analysis: concepts, methods, and recent results. Landscape Ecol. 15, 5–20 (doi:10.1023/A:1008184408300) - DOI
-
- Margules CR, Pressey RL. 2000. Systematic conservation planning. Nature 405, 243–253 (doi:10.1038/35012251) - DOI - PubMed
-
- Rodrigues ASL, et al. 2004. Effectiveness of the global protected area network in representing species diversity. Nature 428, 640–643 (doi:10.1038/nature02422) - DOI - PubMed
Publication types
MeSH terms
Grants and funding
LinkOut - more resources
Full Text Sources
Other Literature Sources
Miscellaneous
