. 2015 Feb 27;290(9):5592-605.
doi: 10.1074/jbc.M114.616714. Epub 2015 Jan 5.

Glycogen synthase kinase-3 (GSK3) inhibition induces prosurvival autophagic signals in human pancreatic cancer cells

Affiliations

Glycogen synthase kinase-3 (GSK3) inhibition induces prosurvival autophagic signals in human pancreatic cancer cells

Benoît Marchand et al. J Biol Chem. .

Abstract

Glycogen synthase kinase-3 (GSK3) are ubiquitously expressed serine-threonine kinases involved in a plethora of functions ranging from the control of glycogen metabolism to transcriptional regulation. We recently demonstrated that GSK3 inhibition triggers JNK-cJUN-dependent apoptosis in human pancreatic cancer cells. However, the comprehensive picture of downstream GSK3-regulated pathways/functions remains elusive. Herein, counterbalancing the death signals, we show that GSK3 inhibition induces prosurvival signals through increased activity of the autophagy/lysosomal network. Our data also reveal a contribution of GSK3 in the regulation of the master transcriptional regulator of autophagy and lysosomal biogenesis, transcription factor EB (TFEB) in pancreatic cancer cells. Similarly to mammalian target of rapamycin (mTOR) inhibition, GSK3 inhibitors promote TFEB nuclear localization and leads to TFEB dephosphorylation through endogenous serine/threonine phosphatase action. However, GSK3 and mTOR inhibition impinge differently and independently on TFEB phosphorylation suggesting that TFEB is regulated by a panel of kinases and/or phosphatases. Despite their differential impact on TFEB phosphorylation, both GSK3 and mTOR inhibitors promote 14-3-3 dissociation and TFEB nuclear localization. Quantitative mass spectrometry analyses further reveal an increased association of TFEB with nuclear proteins upon GSK3 and mTOR inhibition suggesting a positive impact on TFEB transcriptional function. Finally, a predominant nuclear localization of TFEB is unveiled in fully fed pancreatic cancer cells, whereas a reduction in TFEB expression significantly impairs their capacity for growth in an anchorage-independent manner. In addition, TFEB-restricted cells are more sensitive to apoptosis upon GSK3 inhibition. Altogether, our data uncover new functions under the control of GSK3 in pancreatic cancer cells in addition to providing key insight into TFEB regulation.

Keywords: 14-3-3 Protein; Apoptosis; Autophagy; Glycogen Synthase Kinase 3 (GSK-3); Pancreatic Cancer; Transcription Factor.


Figures

FIGURE 1.
FIGURE 1.
Inhibition of GSK3 activity induces an autophagic response in human pancreatic cancer cells. A, PANC1 cells were treated for the indicated time period with vehicle (DMSO) or GSK3 inhibitor CHIR99021 (CHIR; 5 μm). B, PANC1 cells were treated for 48 h with DMSO or CHIR99021 (CHIR; 5 μm). Chloroquine (CQ; 25 μm) was added or not (−) 4 h prior to cell lysis. C, PANC1 cells were infected with lentiviruses encoding either a non-targeting shRNA (shCTL) or a shGSK3β. 72 h post-infection, PANC1 cells were lysed after a 4-h incubation without (−) or with chloroquine (CQ; 25 μm). A–C, total cell lysates were analyzed by immunoblotting using the indicated antibodies. D and E, PANC1 cells were treated for 24 h with DMSO, CHIR99021 (CHIR; 5 μm), or the mTOR inhibitor Torin1 (250 nm). Autophagosome (punctate LC3B) (D) and lysosome (E) labeling was visualized with a Zeiss LSM700 confocal microscope. Images were acquired with a ×20 (D) or 63 (E) objective. Nuclei were stained with DAPI. Scale bars, 20 μm. F, PANC1 cells were treated for 48 h with vehicle (DMSO; D), GSK3 inhibitor CHIR99021 (C; 5 μm), mTOR inhibitor Torin1 (T; 250 nm), or S6K1 inhibitor PF-4708671 (PF; 20 μm). Total cell lysates were analyzed by immunoblotting using the indicated antibodies.
FIGURE 2.
FIGURE 2.
Inhibition of GSK3 activity induces autophagy in non-transformed cells. A, HPDE cells were treated for the indicated time with vehicle (DMSO) or CHIR99021 (CHIR; 5 μm). Total cell lysates were subjected to immunoblotting using the indicated antibodies. B, HPDE cells were treated for 24 h with DMSO, CHIR99021 (CHIR; 5 μm), or Torin1 (250 nm). Autophagosome (punctate LC3B) labeling was performed and nuclei were stained with DAPI. Stack images of 16–17 slices were acquired on a Zeiss LSM700 confocal microscope with a ×100 objective and the merged image is shown. Scale bars, 10 μm. C, exponentially growing Gsk3β+/+ and Gsk3β−/− MEF were harvested and total cell lysates were analyzed by immunoblotting using the indicated antibodies.
FIGURE 3.
FIGURE 3.
Inhibition of autophagy sensitizes human pancreatic cancer cells to apoptosis upon GSK3 inhibition. A, PANC1 cells were treated for 24 h with vehicle DMSO (−), CHIR99021 (CHIR; 5 μm), and/or Bafilomycin A1 (BAF; 50 nm). B, PANC1 cells were infected with lentiviruses encoding either a non-targeting shRNA (shCTL) or a shGSK3β. 48-h post-infection cells were treated with vehicle DMSO (−) or Bafilomycin A1 (BAF) for 24 h. C, PANC1 cells were transfected with either a control siRNA or siATG5. The following day, cells were treated with DMSO (−) or CHIR99021 (CHIR) for 48 h. A-C, total cell lysates were analyzed by immunoblotting using the indicated antibodies. D, PANC1 cells were seeded in soft-agarose and treated with DMSO, CHIR99021 (CHIR; 5 μm), and/or Bafilomycin A1 (BAF; 5 nm). After 3 weeks, colonies were stained with 3-(4,5-dimethylthiazol-2-yl)-2,5-diphenyltetrazolium bromide. Representative images of one experiment are shown. Colonies were counted using the ImageJ software and the number of colonies in control (DMSO-treated) was set at 1. A graphical representation of 3–5 independent experiments performed in duplicate is shown. ***, p ≤ 0.0001 as compared with DMSO-treated cells. #, p ≤ 0.05; ##, p ≤ 0.01.
FIGURE 4.
FIGURE 4.
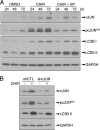
JNK-cJUN activation is not required for the GSK3 inhibition-induced autophagy. A, PANC1 cells were treated for the indicated time with vehicle DMSO, CHIR99021 (CHIR; 5 μm), and/or the JNK inhibitor SP600125 (SP; 25 μm). B, stable cell populations of PANC1-shCTL and PANC1-shcJUN were treated for 72 h with DMSO (−) or CHIR99021 (CHIR; 5 μm). A and B, total cell lysates were analyzed by immunoblotting using the indicated antibodies.
FIGURE 5.
FIGURE 5.
GSK3 inhibition promotes TFEB nuclear localization. A and B, confocal microscopy analysis of the subcellular distribution of the transfected TFEB-EGFP in HEK293T cells (A) and PANC1 (B) incubated 1 h (A) or not (B) with vehicle DMSO, CHIR99021 (5 μm), or Torin1 (250 nm). Nuclei were stained with DAPI. Scale bars, 10 μm. C–E, PANC1 cells were incubated for 1 h with vehicle DMSO, CHIR99021 (5 μm), or Torin1 (250 nm). Subcellular localization of the endogenous TFEB was analyzed by confocal microscopy using an antibody against TFEB. Nuclei were stained with DAPI. Representative micrographs are shown (C). Scale bars, 20 μm. D, quantification of the percentage of PANC1 cells with nuclear TFEB staining. E, quantification of the percentage of colocalization of TFEB with DAPI. ***, p ≤ 0.0001 compared with DMSO-treated cells. F, confocal microscopy analysis of the subcellular distribution of TFEB in HPDE incubated 1 h with vehicle DMSO or CHIR99021 (CHIR; 5 μm). Scale bars, 20 μm.
FIGURE 6.
FIGURE 6.
GSK3 inhibition modifies TFEB electrophoretic mobility. A, PANC1 cells were incubated for 1 h with vehicle DMSO (D), CHIR99021 (C; 5 μm), or Torin1 (T; 250 nm). Cytosolic and nuclear proteins were fractionated as described under ”Experimental Procedures.“ Immunoblotting analyses of total cell lysates (TL), cytosolic and nuclear fractions were performed using the specified antibodies. B, PANC1 cells were infected with lentiviruses encoding either a non-targeting shRNA (shCTL) or a combination of shGSK3α and shGSK3β. Total cell lysates were prepared 72 h post-infection. C, HEK293T, PANC1, and MIA PaCa-2 (MIA) cells were treated 1 h with DMSO (D), CHIR99021 (C; 5 μm), or Torin1 (T; 250 nm). TFEB expression levels and S6K1 activity were analyzed by immunoblotting. D, PANC1 cells were transfected with either a control siRNA or siATG5. The following day, cells were treated with DMSO (−) or CHIR99021 (CHIR) for 24 h. E, PANC1 cells were treated for 48 h with vehicle DMSO (−), CHIR99021 (CHIR; 5 μm), and/or a pan-caspase inhibitor (CASP inh.; 10 μm). B–E, total cell lysates were analyzed by immunoblotting using the indicated antibodies. The asterisk (*) denotes the GSK3 inhibition-induced accelerated mobility shift of TFEB.
FIGURE 7.
FIGURE 7.
GSK3 inhibition leads to the dephosphorylation of TFEB. A, PANC1 cells were pre-treated (+) or not (−) for 15 min with Calyculin A (10 nm) followed by a 30-min incubation with DMSO, CHIR99021 (CHIR; 5 μm), or Torin1 (250 nm). Total cell lysates were analyzed by immunoblotting using the indicated antibodies. The asterisk (*) denotes the GSK3 inhibition-induced accelerated mobility shift of TFEB. B, HEK293T cells were transfected or not (NT) with the TFEB-EGFP expression vector. Twenty-four hours post-transfection, cells were treated for 1 h with vehicle DMSO (D), CHIR99021 (C; 5 μm), or Torin1 (T; 250 nm). Total cell lysates were prepared and TFEB-EGFP was immunoprecipitated using GFP-Trap-agarose beads followed by immunoblotting analyses of immunoprecipitates. TFEB-EGFP expression was analyzed using an anti-GFP antibody. Phosphorylation of TFEB-EGFP on Ser211 was analyzed using an anti-phospho-Ser 14-3-3 binding motif.
FIGURE 8.
FIGURE 8.
GSK3 and mTOR inhibition modifies the profile of TFEB interacting partners. A and B, HEK293T (A) and PANC1 (B) cells were transfected or not (NT) with the TFEB-EGFP expression vector. Twenty-four hours post-transfection, cells were treated for 1 h with vehicle DMSO (D), CHIR99021 (C; 5 μm), or Torin1 (T; 250 nm). Total cell lysates were prepared and TFEB-EGFP was immunoprecipitated using GFP-Trap-agarose beads followed by immunoblotting analyses of immunoprecipitates and their inputs. C, quantitative mass spectrometry analysis of medium (M) and heavy (H)-labeled HEK293T cells transfected with TFEB-EGFP compared with control (nontransfected) light (L)-labeled HEK293T. M-labeled HEK293T were treated for 1 h with DMSO (as control), whereas H-labeled HEK293T cells were treated with CHIR99021 (CHIR; 5 μm) (top) or Torin1 (250 nm) (bottom) for 1 h. Medium/light (M/L) ratios (enriched peptides in TFEB immunoprecipitates in control (DMSO-treated) cells) are plotted against heavy/medium (H/M) ratios (enriched peptides in TFEB immunoprecipitates following CHIR (top) or Torin1 (bottom) treatment). Only the top 20% M/L ratio peptides in both experiments and/or the top 20% H/M ratio peptides were plotted. For a complete list see Table 1.
FIGURE 9.
FIGURE 9.
TFEB knockdown sensitizes pancreatic cancer cells to apoptosis upon GSK3 inhibition. A, total cell lysates from stable populations of PANC1-shCTL and PANC1-shTFEB were analyzed by immunoblotting using the indicated antibodies. B, stable populations of PANC1-shCTL and PANC1-shTFEB cells were treated for 48 h with CHIR99021 (CHIR; 5 μm). Bafilomycin A1 (BAF; 50 nm) was added or not (−) 4 h prior to cell lysis. LC3B II and GAPDH expression levels were analyzed by immunoblotting. Representative immunoblots are shown. A graphical representation of LC3B II/GAPDH expression levels where the ratio in cells untreated with Bafilomycin A1 was set at 1 is shown. *, p ≤ 0.05. ns = not significant. C, stable populations of PANC1-shCTL and PANC1-shTFEB cells were seeded in soft-agarose, cultured for 3 weeks in the presence of DMSO or CHIR99021 (CHIR; 5 μm), colonies were stained and counted. Representative images of one experiment are shown. A graphical representation of 4 independent experiments performed in duplicate is shown. The number of colonies in PANC1-shCTL was set at 1. ***, p ≤ 0.001 as compared with shCTL, DMSO-treated cells; #, p ≤ 0.05; ##, p ≤ 0.01. D, stable populations of PANC1-shCTL and PANC1-shTFEB cells were treated for 48 h with DMSO (D), GSK3 inhibitors CHIR99021 (C; 5 μm) or SB216763 (S; 20 μm), or Torin1 (T; 250 nm). Total cell lysates were analyzed by immunoblotting using the indicated antibodies. The asterisk (*) denotes the GSK3 inhibitor-induced accelerated mobility shift of TFEB.

References

    1. Bardeesy N., DePinho R. A. (2002) Pancreatic cancer biology and genetics. Nat. Rev. Cancer 2, 897–909 - PubMed
    1. Hezel A. F., Kimmelman A. C., Stanger B. Z., Bardeesy N., Depinho R. A. (2006) Genetics and biology of pancreatic ductal adenocarcinoma. Genes Dev. 20, 1218–1249 - PubMed
    1. Schneider G., Siveke J. T., Eckel F., Schmid R. M. (2005) Pancreatic cancer: basic and clinical aspects. Gastroenterology 128, 1606–1625 - PubMed
    1. Jones S., Zhang X., Parsons D. W., Lin J. C., Leary R. J., Angenendt P., Mankoo P., Carter H., Kamiyama H., Jimeno A., Hong S. M., Fu B., Lin M. T., Calhoun E. S., Kamiyama M., Walter K., Nikolskaya T., Nikolsky Y., Hartigan J., Smith D. R., Hidalgo M., Leach S. D., Klein A. P., Jaffee E. M., Goggins M., Maitra A., Iacobuzio-Donahue C., Eshleman J. R., Kern S. E., Hruban R. H., Karchin R., Papadopoulos N., Parmigiani G., Vogelstein B., Velculescu V. E., Kinzler K. W. (2008) Core signaling pathways in human pancreatic cancers revealed by global genomic analyses. Science 321, 1801–1806 - PMC - PubMed
    1. Bang D., Wilson W., Ryan M., Yeh J. J., Baldwin A. S. (2013) GSK-3α promotes oncogenic KRAS function in pancreatic cancer via TAK1-TAB stabilization and regulation of noncanonical NF-κB. Cancer Discov. 3, 690–703 - PMC - PubMed

Publication types

MeSH terms

Substances