. 2015 Mar 6;290(10):6361-75.
doi: 10.1074/jbc.M114.627646. Epub 2015 Jan 5.

Biochemical reconstitution and phylogenetic comparison of human SET1 family core complexes involved in histone methylation

Affiliations

Biochemical reconstitution and phylogenetic comparison of human SET1 family core complexes involved in histone methylation

Stephen A Shinsky et al. J Biol Chem. .

Abstract

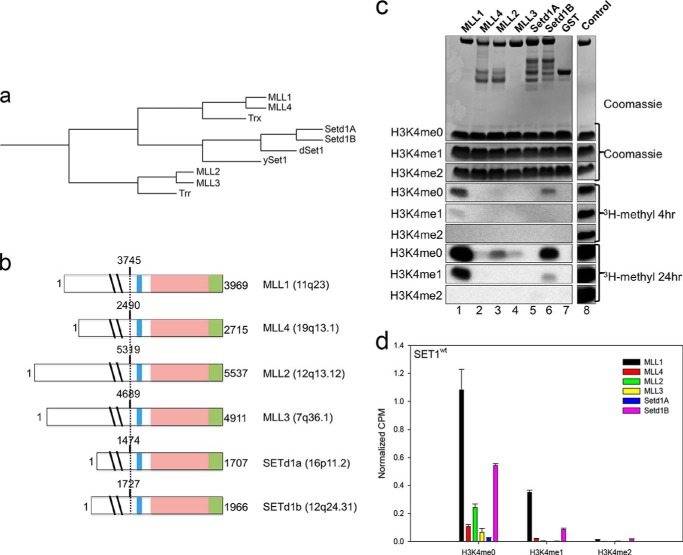
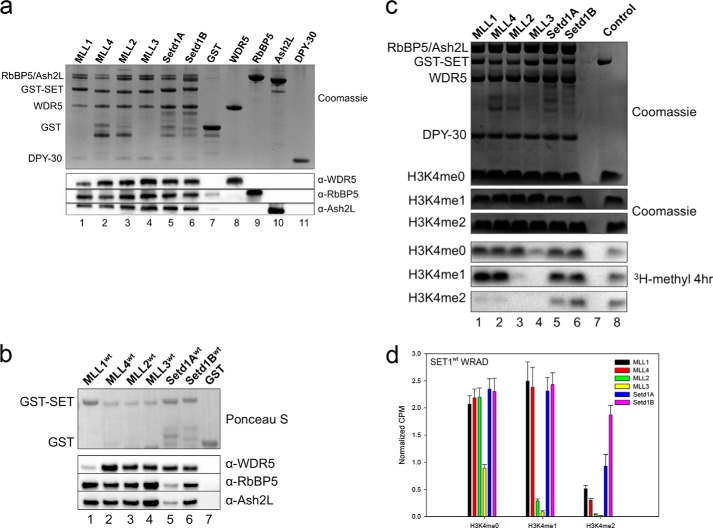
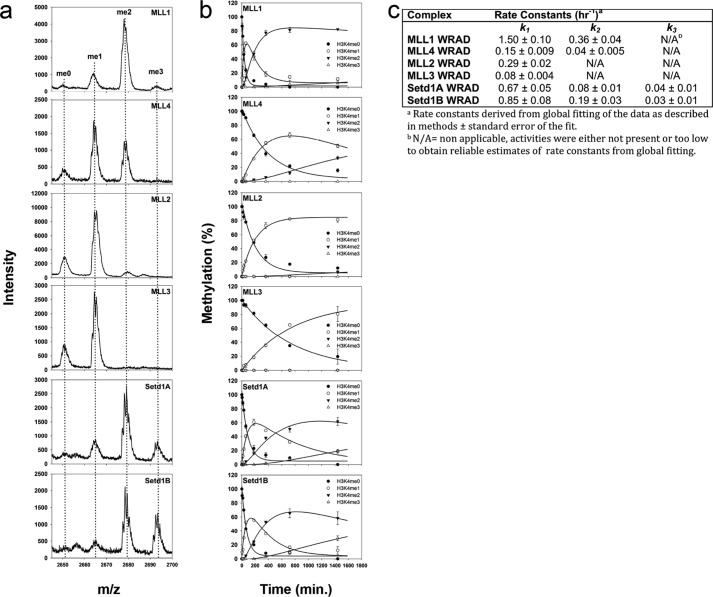
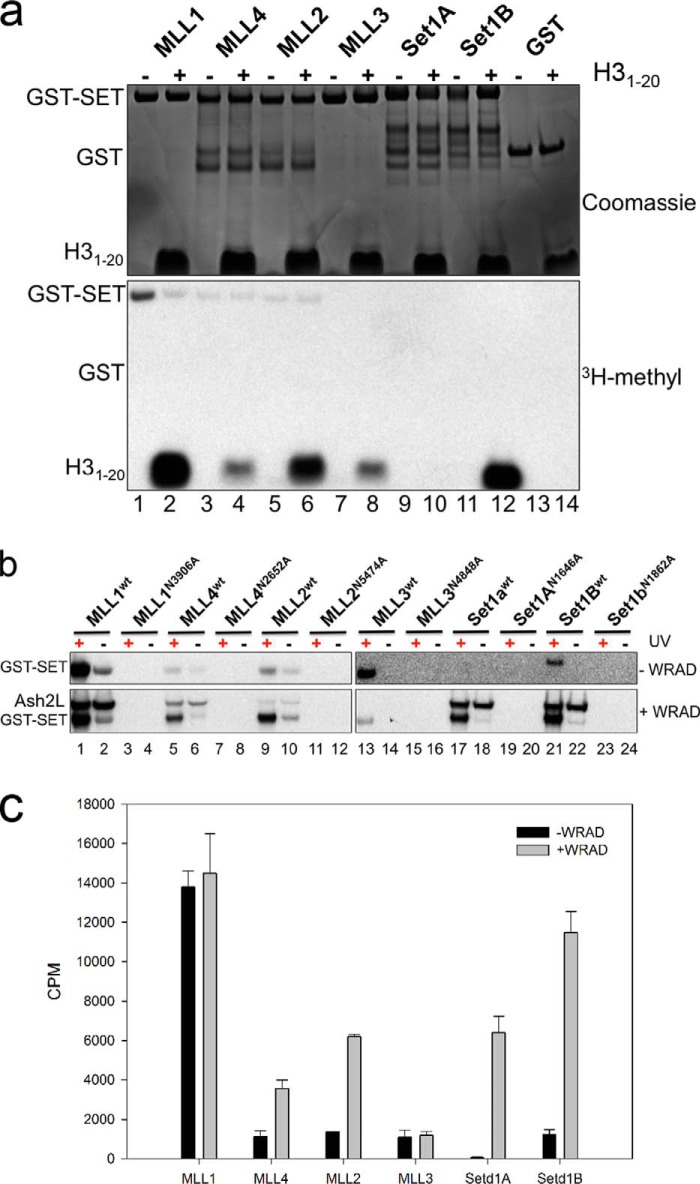
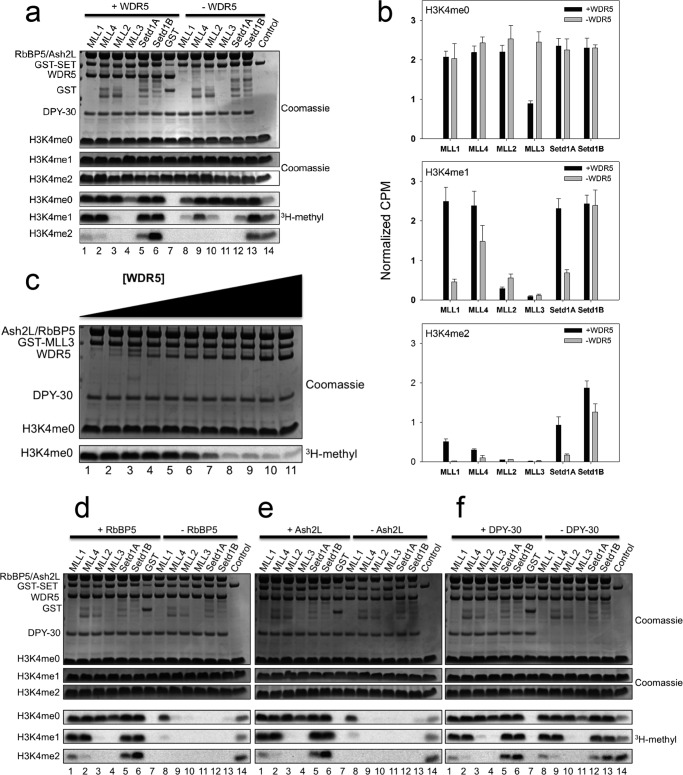
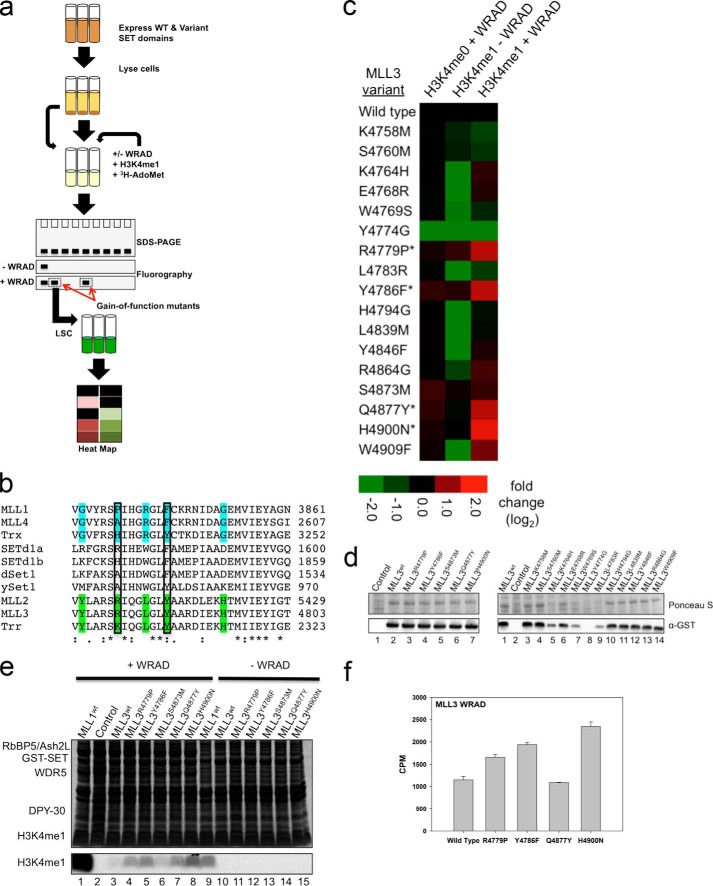
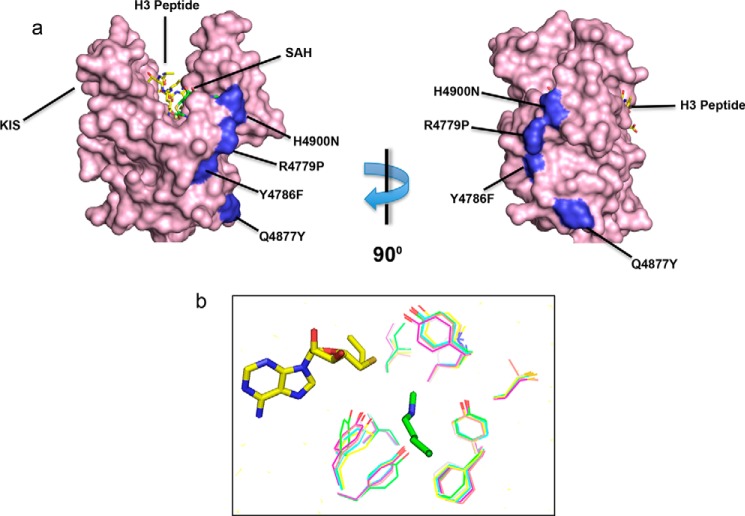
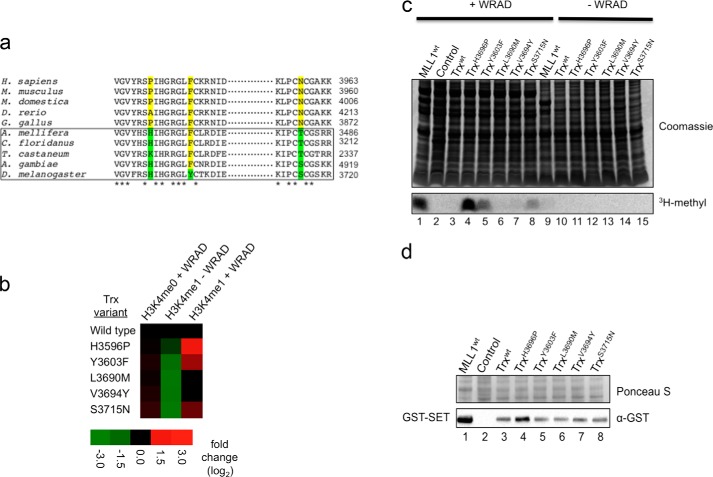
Mixed lineage leukemia protein-1 (MLL1) is a member of the SET1 family of histone H3 lysine 4 (H3K4) methyltransferases that are required for metazoan development. MLL1 is the best characterized human SET1 family member, which includes MLL1-4 and SETd1A/B. MLL1 assembles with WDR5, RBBP5, ASH2L, DPY-30 (WRAD) to form the MLL1 core complex, which is required for H3K4 dimethylation and transcriptional activation. Because all SET1 family proteins interact with WRAD in vivo, it is hypothesized they are regulated by similar mechanisms. However, recent evidence suggests differences among family members that may reflect unique regulatory inputs in the cell. Missing is an understanding of the intrinsic enzymatic activities of different SET1 family complexes under standard conditions. In this investigation, we reconstituted each human SET1 family core complex and compared subunit assembly and enzymatic activities. We found that in the absence of WRAD, all but one SET domain catalyzes at least weak H3K4 monomethylation. In the presence of WRAD, all SET1 family members showed stimulated monomethyltransferase activity but differed in their di- and trimethylation activities. We found that these differences are correlated with evolutionary lineage, suggesting these enzyme complexes have evolved to accomplish unique tasks within metazoan genomes. To understand the structural basis for these differences, we employed a "phylogenetic scanning mutagenesis" assay and identified a cluster of amino acid substitutions that confer a WRAD-dependent gain-of-function dimethylation activity on complexes assembled with the MLL3 or Drosophila trithorax proteins. These results form the basis for understanding how WRAD differentially regulates SET1 family complexes in vivo.

Keywords: Ash2L; Cancer; Epigenetics; Histone Methylation; Leukemia; MLL; Phylogenetics; Product Specificity; SET1; WDR5.


Figures

FIGURE 1.
FIGURE 1.
Human SET1 family members predominantly catalyze monomethylation of H3K4. a, phylogenetic cluster analysis (Clustal Omega (66)) of SET1 family members using full-length protein sequences from Saccharomyces cerevisiae (ySet1), Drosophila (dSet1, Trx, and Trr), and humans (MLL1–4, SETd1A/B). b, schematic representation of full-length human SET1 family proteins. The catalytic SET domain is shown in light pink; the post-SET region is shown in green, and the WDR5 interaction (Win) motif is shown in blue. Dotted lines represent the N terminus of the recombinant constructs used in this study, beginning with the residues noted above each construct. c, comparison of histone methyltransferase activity among human SET1 family SET domains. Upper panels show Coomassie Blue-stained SDS-polyacrylamide gels, and the lower panels shows [3H]methyl incorporation by fluorography after a 4-h exposure (middle panels), and after a 24-h exposure (lowest panels). The control lane shows the activity of the MLL1 SET domain on 100 μm unmodified H3 peptide, which is included on each gel. The control lanes are from the same gel at the same exposure but were cropped for clarity. d, quantification of radioactivity from excised histone H3 bands by LSC. Data are normalized to the activity level of the control lane on each gel. Error bars represent the S.E. of measurement between three independent experiments.
FIGURE 2.
FIGURE 2.
SET1 family core complexes catalyze different levels of H3K4 methylation. a, comparison of core complex assembly with each human SET1 family member by in vitro GST pulldown assays from purified components. Individual GST-tagged SET domains were incubated with purified WRAD components and glutathione-coated agarose beads. The upper panel shows a Coomassie Blue-stained gel, and the lower panels show the Western blot. Purified GST is used as a negative control (lane 7). Purified individual WRAD subunits were run on the gel (lanes 8–11) to compare with the migration of WRAD components from the pulldown lanes (lanes 1–8). b, comparison of core complex assembly with each human SET1 family member by in vitro pulldown experiments from MCF-7 breast cancer cell extracts. Individual GST-tagged SET domains were incubated with cell extracts and pulled down with glutathione-agarose beads. WRA components were detected by Western blotting. The upper panel shows a Ponceau S-stained PVDF membrane, and the lower panels show the Western blot. c, comparison of core complex methyltransferase activities among SET1 family members in complex with WRAD. The upper panels show Coomassie Blue-stained SDS-polyacrylamide gels, and the lower panels show [3H]methyl incorporation after 4 h as shown by fluorography. The control lane shows the activity of the MLL1 SET domain on 100 μm unmodified H3 peptide, which is included on each gel. d, quantification of radioactivity from excised histone H3 bands by LSC. Data are normalized to the activity level of the control lane on each gel. Error bars represent the S.E. of measurement between five independent experiments.
FIGURE 3.
FIGURE 3.
SET1 family core complex single turnover kinetics. a, MALDI-TOF mass spectrometry showing histone methylation of an unmodified H3 peptide after 24 h for each human SET1 family core complex. b, reaction progress curves globally fitted to irreversible consecutive reaction models using DynaFit. Each time point represents the mean percentage of total integrated area for each species in MALDI-TOF reactions. Error bars represent ± S.D. from duplicate measurements. c, summary of rate constants derived from global fitting of reaction progress curves as described under “Experimental Procedures.”
FIGURE 4.
FIGURE 4.
AdoMet cross-linking studies of the human SET1 family members. a, subset of SET1 family members undergoing auto-methylation. Isolated SET domains were incubated with [3H]AdoMet in the presence (+) or absence (−) of 250 μm unmodified H3 peptide. The upper panel shows a Coomassie Blue-stained SDS-polyacrylamide gel, and the lower panel shows [3H]methyl incorporation by fluorography after a 24-h exposure to film. b, UV exposure was used to cross-link [3H]AdoMet to isolated SET1 family SET domains (upper panels) or SET1 family core complexes (lower panels). All panels represent [3H]methyl incorporation by fluorography after a 3-day exposure to film. A single asparagine to alanine mutation in the AdoMet binding pocket of each SET domain abolishes [3H]AdoMet cross-linking. c, quantification of [3H]AdoMet cross-linking in the presence and absence of WRAD. Bands corresponding to the SET domains of each wild type SET1 family member were excised and quantified by liquid scintillation counting as described under “Experimental Procedures.” Error bars represent the S.E. of measurement from three independent experiments.
FIGURE 5.
FIGURE 5.
Functions of WRAD components in the SET1 family of core complexes. a, comparison of H3K4 methylation activity by SET1 family core complexes assembled with and without WDR5. The upper panels show Coomassie Blue-stained SDS-polyacrylamide gels, and the lower panels show [3H]methyl incorporation after a 4-h exposure to film. b, quantification of methyltransferase activity among SET1 family core complexes assembled with and without WDR5 by liquid scintillation counting. Error bars represent the S.E. of measurement from three to five independent experiments. c, titration of WDR5 into the MLL3-RAD complex. A 3 μm MLL3-RAD complex was assembled with increasing amounts of WRD5 and tested for methyltransferase activity when an unmodified H3 peptide was the substrate. WDR5 was titrated in 0.5 μm increments in lanes 1–9 and in 1 μm increments for lanes 10 and 11 (range is from 0 to 6 μm). d–f, comparison of H3K4 methylation activity by SET1 family core complexes assembled with and without RBBP5 (d), ASH2L (e), and DPY-30 (f). The upper panels show Coomassie Blue-stained SDS-polyacrylamide gels, and the lower panels show [3H]methyl incorporation after 4 h as shown by fluorography. All gels contain the activity of the isolated MLL1 SET domain on 100 μm unmodified H3 peptide as a control.
FIGURE 6.
FIGURE 6.
Phylogenetic scanning mutagenesis reveals a cluster of mutations that enhance the dimethylation activity of the MLL3 core complex. a, schematic of the phylogenetic scanning mutagenesis assay. Mutant constructs were expressed in 5-ml cultures, and lysates were analyzed for protein expression. Purified WRAD components along with [3H]AdoMet and H3 peptides (unmodified or previously mono-methylated at H3K4) were incubated with the lysates. Fluorography and liquid scintillation counting were used to analyze activity. b, representative sequence alignment of SET1 family SET domains (Clustal Omega). The MLL1 homologs are highlighted in blue, and the MLL3 homologs are highlighted in green. The two boxed positions represent gain-of-function hits from the screen. c, heat map of methyltransferase activities of wild type and mutant MLL3 constructs. The data represent the log2-fold change (mutant/wild type) in activity of MLL3 constructs with the indicated peptide. Asterisk represents significant increase in dimethylation activity (p < 0.01). d, assessment of the expression level of mutant MLL3 constructs. Lysate samples from mutant and wild type constructs were separated by SDS-PAGE, transferred to PVDF membranes, and blotted with an α-GST antibody. The upper panels show Ponceau S-stained PVDF membranes, and the lower panels show the Western blots. The control represents an untransformed E. coli lysate that was induced with 1 mm IPTG. e, representative gel of gain-of-function MLL3 mutants. The upper panel depicts a Coomassie Blue-stained SDS-polyacrylamide gel, and the lower panel shows [3H]methyl incorporation after 2 days as shown by fluorography. f, UV exposure was used to cross-link [3H]AdoMet to wild type or MLL3 variant core complexes. [3H]AdoMet cross-linking was quantitated by LSC of excised SET domain bands. Error bars represent S.E. of measurement from three independent experiments.
FIGURE 7.
FIGURE 7.
a, surface representation of the crystal structure of the MLL1 SET domain bound to histone H3 peptide (yellow) and S-adenosyl-l-homocysteine (SAH) (green) (Protein Data Bank code 2W5Z) (67). The position of the four gain-of-function mutants are highlighted in blue and noted with their MLL3 numbering. The location of the previously identified Kabuki interaction surface (KIS) is noted. b, homology modeling of the conserved active site residues in the human SET1 family predicts that they adopt similar three-dimensional positions. Models were generated in Modeler (68) using the MLL1 structure (PDB code 2W5Z) as a template.
FIGURE 8.
FIGURE 8.
Gain-of-function positions identified in MLL3 enhance WRAD-dependent dimethylation by the complex assembled with Drosophila Trx. a, representative alignment of MLL1 orthologs reveals amino acid positions that show a split between invertebrates (boxed) and vertebrates. b, heat map of methyltransferase activities of wild type and mutant Trx constructs. The data represent the log2-fold change (mutant/wild type) in activity of Trx constructs with the indicated peptide. c, representative gel of gain-of-function Trx mutants. The upper panel shows a Coomassie Blue-stained SDS-polyacrylamide gel, and the lower panel shows [3H]methyl incorporation after 24 h of fluorography. d, assessment of the expression level of mutant Trx constructs. Lysate samples from mutant and wild type constructs were separated by SDS-PAGE, transferred to PVDF membranes, and blotted with an α-GST antibody. The upper panel shows a Ponceau S-stained PVDF membrane, and the lower panel shows the Western blot. The control represents an untransformed E. coli lysate that was induced with 0.75 mm IPTG.

Similar articles

Cited by

References

    1. Strahl B. D., Ohba R., Cook R. G., Allis C. D. (1999) Methylation of histone H3 at lysine 4 is highly conserved and correlates with transcriptionally active nuclei in Tetrahymena. Proc. Natl. Acad. Sci. U.S.A. 96, 14967–14972 - PMC - PubMed
    1. Santos-Rosa H., Schneider R., Bannister A. J., Sherriff J., Bernstein B. E., Emre N. C., Schreiber S. L., Mellor J., Kouzarides T. (2002) Active genes are tri-methylated at K4 of histone H3. Nature 419, 407–411 - PubMed
    1. Liu C. L., Kaplan T., Kim M., Buratowski S., Schreiber S. L., Friedman N., Rando O. J. (2005) Single-nucleosome mapping of histone modifications in S. cerevisiae. PLoS Biol. 3, e328. - PMC - PubMed
    1. Pokholok D. K., Harbison C. T., Levine S., Cole M., Hannett N. M., Lee T. I., Bell G. W., Walker K., Rolfe P. A., Herbolsheimer E., Zeitlinger J., Lewitter F., Gifford D. K., Young R. A. (2005) Genome-wide map of nucleosome acetylation and methylation in yeast. Cell 122, 517–527 - PubMed
    1. Heintzman N. D., Stuart R. K., Hon G., Fu Y., Ching C. W., Hawkins R. D., Barrera L. O., Van Calcar S., Qu C., Ching K. A., Wang W., Weng Z., Green R. D., Crawford G. E., Ren B. (2007) Distinct and predictive chromatin signatures of transcriptional promoters and enhancers in the human genome. Nat. Genet. 39, 311–318 - PubMed

Publication types

MeSH terms

Associated data