

Effect of Cysteamine on Cell Growth and IgG4 Production in Recombinant Sp2.0 Cells
- PMID: 25561924
- PMCID: PMC4277631
Effect of Cysteamine on Cell Growth and IgG4 Production in Recombinant Sp2.0 Cells
Abstract
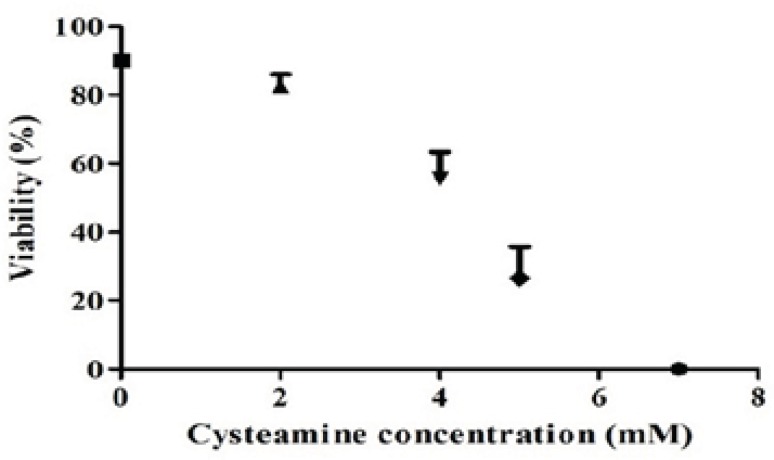
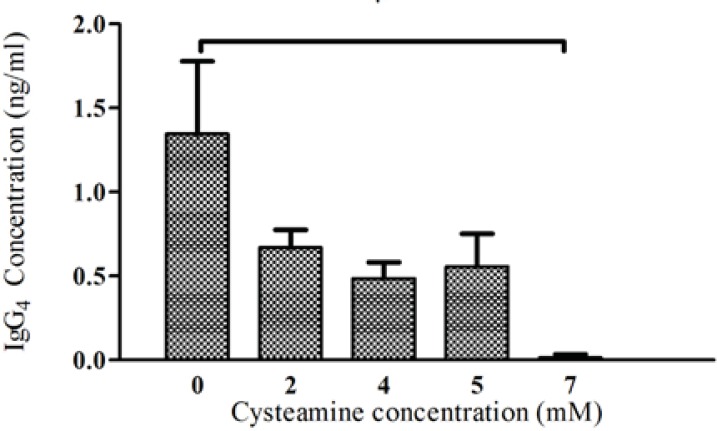
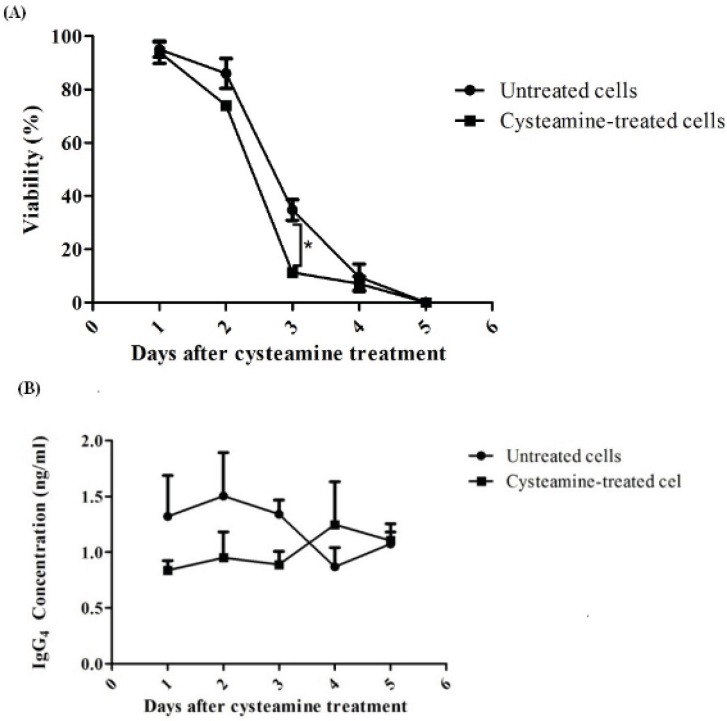
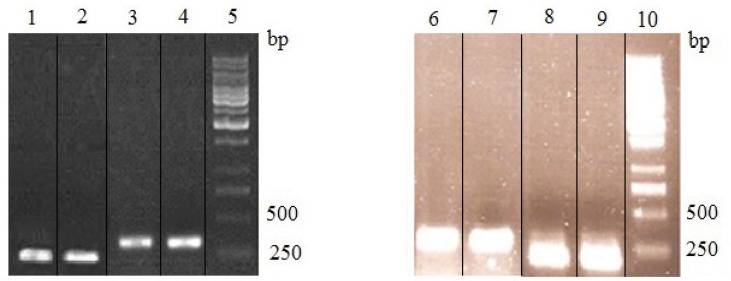
The manipulation of redox potential in secretory pathway by thiol reducing agents can be a strategy to improve the production levels of disulfide-bonded proteins including recombinant antibodies. Here we have studied the influence of cysteamine on viability and the production level of IgG4 in Sp2.0 cells. For this purpose, the recombinant Sp2.0 cells producing an anti CD33 IgG4, were subjected to different concentrations of cysteamine. At concentrations of 2, 4 and 5 mM cysteamine, the secreted levels of IgG4 did not change significantly. However, in concentration of 7 mM cysteamine, a significant decrease was observed in IgG4 levels which may indicate the cytotoxicity of this compound in higher concentrations. Our results show that the cysteamine treatment reduces the cell viability in a dose-dependent manner. Also it was observed that 2 mM cysteamine had no late effect on IgG4 production level and only at day 3, this concentration of cysteamine decreased the cell viability significantly. To test whether the addition of cysteamine can affect the expression level of protein disulfide isomerase, RT-PCR analysis was carried out. The results revealed that cysteamine does not affect the PDI transcription and expression level of IgG4 in this type of recombinant cells.
Keywords: Cysteamine; IgG4; Monoclonal antibody; Protein disulfide isomerase; Sp2.0 cells; Thiol reducing agents.
Figures
Similar articles
-
Protein disulfide isomerase does not control recombinant IgG4 productivity in mammalian cell lines.Biotechnol Bioeng. 2010 Mar 1;105(4):770-9. doi: 10.1002/bit.22587. Biotechnol Bioeng. 2010. PMID: 19882737
-
Cellular thiol pools are responsible for sequestration of cytotoxic reactive aldehydes: central role of free cysteine and cysteamine.Brain Res. 2007 Jul 16;1158:158-63. doi: 10.1016/j.brainres.2007.05.007. Epub 2007 May 10. Brain Res. 2007. PMID: 17555724
-
Evaluation of protein disulfide conversion in vitro using a continuous flow dialysis system.Anal Biochem. 2013 Jan 15;432(2):142-54. doi: 10.1016/j.ab.2012.09.027. Epub 2012 Sep 27. Anal Biochem. 2013. PMID: 23022378
-
Immunoglobulin G4: an odd antibody.Clin Exp Allergy. 2009 Apr;39(4):469-77. doi: 10.1111/j.1365-2222.2009.03207.x. Epub 2009 Feb 13. Clin Exp Allergy. 2009. PMID: 19222496 Review.
-
Influence of Vanin-1 and Catalytic Products in Liver During Normal and Oxidative Stress Conditions.Curr Med Chem. 2015;22(20):2407-16. doi: 10.2174/092986732220150722124307. Curr Med Chem. 2015. PMID: 26549544 Review.
Cited by
-
Enhancing Antibody-Specific Productivity: Unraveling the Impact of XBP1s Overexpression and Glutamine Availability in SP2/0 Cells.Bioengineering (Basel). 2024 Feb 21;11(3):201. doi: 10.3390/bioengineering11030201. Bioengineering (Basel). 2024. PMID: 38534475 Free PMC article.
-
LATS1/2 suppress NFκB and aberrant EMT initiation to permit pancreatic progenitor differentiation.PLoS Biol. 2019 Jul 19;17(7):e3000382. doi: 10.1371/journal.pbio.3000382. eCollection 2019 Jul. PLoS Biol. 2019. PMID: 31323030 Free PMC article.
References
-
- Walsh G. Biopharmaceutical benchmarks. Nat. Biotechnol. 2010;28:917–924. - PubMed
-
- Costa AR, Rodrigues ME, Henriques M, Azeredo J, Oliveira R. Guidelines to cell engineering for monoclonal antibody production. Eur. J. Pharm. Biopharm. 2010;74:127–138. - PubMed
-
- Dinnis DM, James DC. Engineering mammalian cell factories for improved recombinant monoclonal antibody production: lessons from nature? Biotechnol. Bioeng. 2005;91:180–189. - PubMed
-
- Jain E, Kumar A. Upstream processes in antibody production: evaluation of critical parameters. Biotechnol. Adv. 2008;26:46–72. - PubMed
LinkOut - more resources
Full Text Sources
Other Literature Sources