Clinical Trial
. 2015 Feb;125(2):739-51.
doi: 10.1172/JCI74894. Epub 2014 Dec 22.

Tumor-specific cytotoxic T lymphocyte activity determines colorectal cancer patient prognosis

Clinical Trial

Tumor-specific cytotoxic T lymphocyte activity determines colorectal cancer patient prognosis

Christoph Reissfelder et al. J Clin Invest. 2015 Feb.

Erratum in

Abstract

The composition of tumor-targeted T cell infiltrates is a major prognostic factor in colorectal cancer (CRC) outcome; however, the functional role of these populations in prolonging patient survival remains unclear. Here, we evaluated 190 patients with CRC for the presence of functionally active tumor-infiltrating lymphocytes (TILs), the tumor specificity of these TILs, and the correlation between patient TILs and long-term survival. Using intracytoplasmic cytokine staining in conjunction with HLA multimers loaded with tumor peptide and antigen-specific cytokine secretion assays, we determined that TNF-α expression delineates a population of tumor antigen-specific (TA-specific) cytotoxic T lymphocytes (CTLs) present within tumors from patients with CRC. Upregulation of TNF-α expression in TILs strongly correlated with an increase in the total amount of intratumoral TNF-α, which is indicative of tumor-specific CTL activity. Moreover, a retrospective multivariate analysis of 102 patients with CRC, which had multiple immune parameters evaluated, revealed that increased TNF-α concentration was an independent prognostic factor. Together, these results indicate that the prognostic impact of T cell infiltrates for CRC maybe largely based on subpopulations of active TA-specific T cells within the tumor, suggesting causal implication for these cells in patient survival. Additionally, these results support the use of intratumoral TNF-α, which is indicative of T cell function, as a prognostic parameter for CRC.


Figures

Figure 5
Figure 5. Cumulative incidence curves with respect to dichotomized levels of TNF-α, Treg, and CD4+ infiltration.
Cumulative incidence curves of UICC stage III patients stratified into groups with TNF-α concentration (median 0.51 pg/ml) (A), tumor infiltration by Tregs (median 1.45 cells per HPF) (B), CD4+ Tconv (median 5.9 cells per HPF) (C), or CD8+ TCs (median 81.7 cells per HPF) (D) above (high) or below/equal (low) median values. The respective numbers of patients at risk are given in Supplemental Table 5.
Figure 4
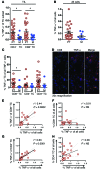
Figure 4. TNF-α expression in TILs correlates with total TNF-α expression in CRC tissue.
(AC) Proportions of TNF-α–positive TCs among TCs (A), among total tumor-infiltrating cells (B), and among all TNF-α–positive cells (C) in primary tumors (PT) or CRC metastases (M) of 36 patients with CRC. Each circle represents values from one patient. TNF-α expression in TCs is separately shown for CD8+, CD4+, and total CD3+ TCs. *P < 0.05, as determined by unpaired 2-tailed t test. Mean ± SEM. (D) In situ expression of TNF-α (red signal) by CD8+ TILs (green signal) in a representative CRC specimen, as shown by immunofluorescence analysis of cryopreserved tissue (original magnification, ×20). (EH) Proportions of TNF-α–positive TCs among CD8+ (E) or CD4+ (G) TILs and of total CD8+ (F) or CD4+ (H) among all tumor-infiltrating cells compared with the proportions of TNF-α–positive TCs among all tumor-infiltrating cells. Circles represent individual data from 27 different primary tumors. Strength and significance of respective correlations are indicated by r2 and P values.
Figure 3
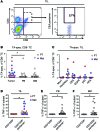
Figure 3. TNF-α expression in CRC tissue is restricted to tumor-specific TCs.
(A) Dot plot showing the presence of CEA-specific TCs among gated CD3+CD8+ TCs in CRC tissue from one representative patient with CRC (n = 15). The proportion of CEA-specific CTLs among gated CD8+ TCs is indicated. (B) Proportions of TA-specific TCs among gated CD8+ TCs in primary (PT) or metastasized (Met) tumor tissue and in blood (PB; white circles) or bone marrow (white circles) of 15 patients with CRC, as determined by staining with tumor peptide-loaded HLA-A2 pentamers. Circles represent data from individual tests with all tested TAs. Mean values are indicated by black lines. *P < 0.05, as determined by unpaired 2-tailed t test. (C) Proportions of tumor-infiltrating TCs from the same patients are separately shown for each tested TA. Mean values are indicated by black lines. (DF) Proportions of TNF-α–positive TCs among CD3+CD8+ TA-specific (pentamer+) or unspecific (CD3+CD8+) TCs isolated from primary or metastasized tumor tissue (TIL) (D), blood (E), or bone marrow (F) of 14 patients with CRC. Circles represent data from individual tests with all tested TAs. Mean values are indicated by black lines. *P < 0.05, as determined by unpaired 2-tailed t test.
Figure 2
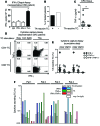
Figure 2. Increased TNF-α content in CRC tissue of patients with TA-reactive TC responses.
(A) IFN-γ ELISPOT from one representative patient with CRC (n = 3), showing IFN-γ spot numbers (triplicates) from wells containing DCs pulsed with PBMC lysate (PB-L), normal colonic mucosa lysate (Muc-L), both autologous or human IgG (IgG) as controls (white bars), or with autologous tumor lysate (Tu-L, black bar). (B) Proportions of patients with CRC showing or lacking tumor-reactive (TA-reactive) TCs in peripheral blood or bone marrow (n = 26). (C) Absolute TNF-α protein concentration in CRC tumors from patients containing (n = 11) or lacking (n = 15) tumor-reactive TCs in peripheral blood or bone marrow. Circles indicate values from individual patients. (D) Expression of IFN-γ and TNF-α in gated CD4+ T and CD8+ TCs in PBTCs stimulated with TA or with human IgG, as determined by cytokine capture assay. Data from one representative patient with CRC (n = 7) is shown. Numbers in dot plots indicate the proportion (%) of cytokine-expressing cells among gated cells. (E) Proportion of cytokine-secreting TA-reactive CD4+ and CD8+ TCs in the blood of 7 patients with CRC. Each symbol represents data from an individual patient with the value of the background reactivity (against IgG) subtracted. (F) Proportion of cytokine-secreting TCs after stimulation with TA or IgG in the blood and bone marrow of 4 patients with CRC. *P < 0.05, as determined by unpaired 2-tailed t test; mean ± SEM.
Figure 1
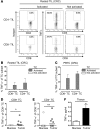
Figure 1. Increased TNF-α expression in activated TCs.
(A) TNF-α expression in polyclonally activated (middle column) but not in unstimulated (right column) CD4+ and CD8+ TILs from one representative patient with CRC (n = 4) was detected by flow cytometry using TNF-α–specific mAb or a respective isotype mAb as negative control (left column). Numbers in dot plots indicate proportions (%) of TNF-α–positive cells among gated cells. (B and C) Mean proportions of TNF-α–expressing CD8+ or CD4+ TCs in rested TILs from 4 patients with CRC (B) and in the blood of 5 patients with CRC (C), without (white bars) or after polyclonal stimulation (gray bars), are shown as the percentage of the respective TC subset. Before analysis, freshly isolated TILs were rested overnight without stimulation. Error bars show mean + SD. (D and E) Proportions of TNF-α–positive CD8+ (D) or CD4+ (E) TCs in freshly isolated TCs from CRC tissue (gray circles) or corresponding normal colonic mucosa (white circles) of 8 patients with CRC. Circles indicate values from individual samples. Mean values are indicated by black lines. (F) Concentrations of TNF-α protein in CRC tissue and corresponding normal colonic mucosa from 14 patients (mean + SEM). *P < 0.1, **P < 0.05, as determined by 2-tailed paired t tests.

References

    1. Mensink PB, Kolkman JJ, Van Baarlen J, Kleibeuker JH. Change in anatomic distribution and incidence of colorectal carcinoma over a period of 15 years: clinical considerations. Dis Colon Rectum. 2002;45(10):1393–1396. doi: 10.1007/s10350-004-6431-6. - DOI - PubMed
    1. Weitz J, Koch M, Debus J, Hohler T, Galle PR, Buchler MW. Colorectal cancer. Lancet. 2005;365(9454):153–165. doi: 10.1016/S0140-6736(05)17706-X. - DOI - PubMed
    1. Galon J, et al. Type, density, and location of immune cells within human colorectal tumors predict clinical outcome. Science. 2006;313(5795):1960–1964. doi: 10.1126/science.1129139. - DOI - PubMed
    1. Pages F, et al. Effector memory T cells, early metastasis, and survival in colorectal cancer. N Engl J Med. 2005;353(25):2654–2666. doi: 10.1056/NEJMoa051424. - DOI - PubMed
    1. Funada Y, Noguchi T, Kikuchi R, Takeno S, Uchida Y, Gabbert HE. Prognostic significance of CD8+ T cell and macrophage peritumoral infiltration in colorectal cancer. Oncol Rep. 2003;10(2):309–313. - PubMed

Publication types