

The surveillance error grid
- PMID: 25562886
- PMCID: PMC4764212
- DOI: 10.1177/1932296814539589
The surveillance error grid
Abstract
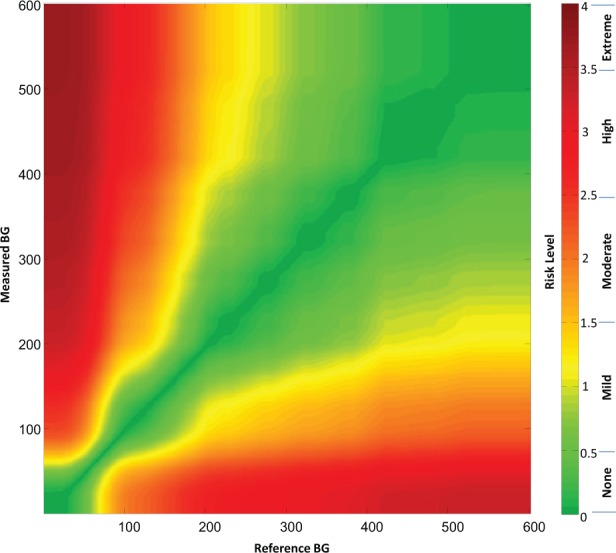
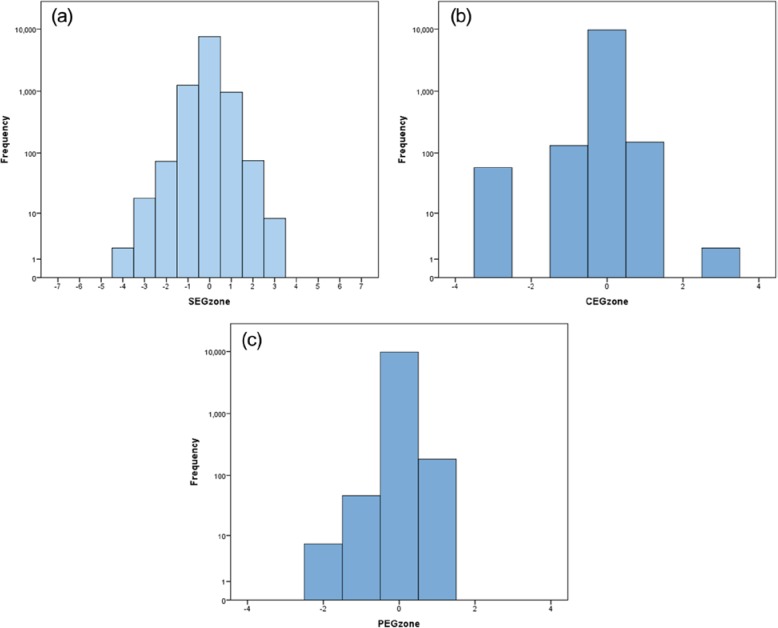
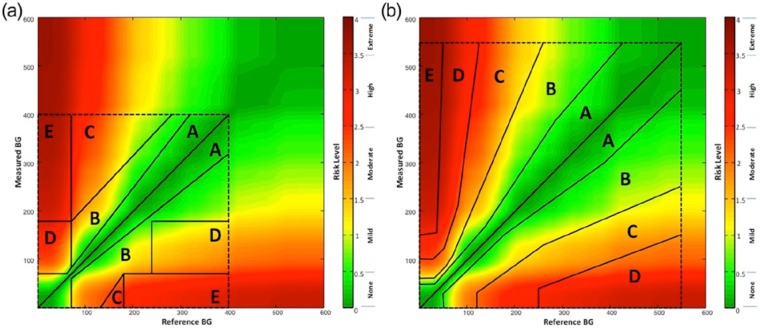
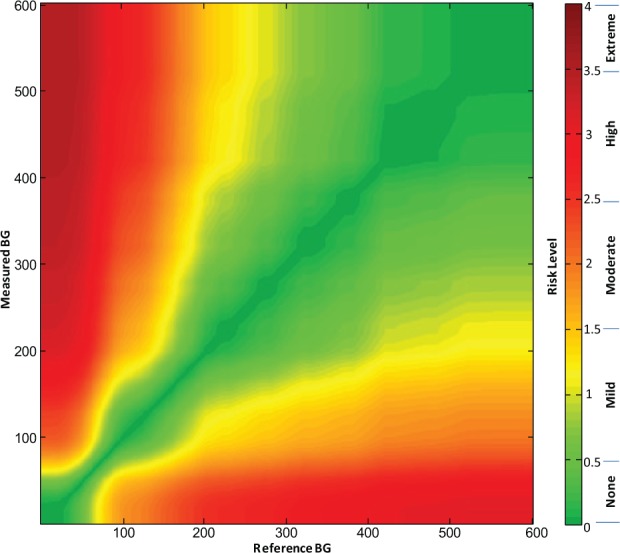
Currently used error grids for assessing clinical accuracy of blood glucose monitors are based on out-of-date medical practices. Error grids have not been widely embraced by regulatory agencies for clearance of monitors, but this type of tool could be useful for surveillance of the performance of cleared products. Diabetes Technology Society together with representatives from the Food and Drug Administration, the American Diabetes Association, the Endocrine Society, and the Association for the Advancement of Medical Instrumentation, and representatives of academia, industry, and government, have developed a new error grid, called the surveillance error grid (SEG) as a tool to assess the degree of clinical risk from inaccurate blood glucose (BG) monitors. A total of 206 diabetes clinicians were surveyed about the clinical risk of errors of measured BG levels by a monitor. The impact of such errors on 4 patient scenarios was surveyed. Each monitor/reference data pair was scored and color-coded on a graph per its average risk rating. Using modeled data representative of the accuracy of contemporary meters, the relationships between clinical risk and monitor error were calculated for the Clarke error grid (CEG), Parkes error grid (PEG), and SEG. SEG action boundaries were consistent across scenarios, regardless of whether the patient was type 1 or type 2 or using insulin or not. No significant differences were noted between responses of adult/pediatric or 4 types of clinicians. Although small specific differences in risk boundaries between US and non-US clinicians were noted, the panel felt they did not justify separate grids for these 2 types of clinicians. The data points of the SEG were classified in 15 zones according to their assigned level of risk, which allowed for comparisons with the classic CEG and PEG. Modeled glucose monitor data with realistic self-monitoring of blood glucose errors derived from meter testing experiments plotted on the SEG when compared to the data plotted on the CEG and PEG produced risk estimates that were more granular and reflective of a continuously increasing risk scale. The SEG is a modern metric for clinical risk assessments of BG monitor errors that assigns a unique risk score to each monitor data point when compared to a reference value. The SEG allows the clinical accuracy of a BG monitor to be portrayed in many ways, including as the percentages of data points falling into custom-defined risk zones. For modeled data the SEG, compared with the CEG and PEG, allows greater precision for quantifying risk, especially when the risks are low. This tool will be useful to allow regulators and manufacturers to monitor and evaluate glucose monitor performance in their surveillance programs.
Keywords: accuracy; blood glucose; error grid; monitor; surveillance.
© 2014 Diabetes Technology Society.
Conflict of interest statement
Figures
References
-
- US Food and Drug Administration. Guidance for industry and FDA staff: recommendations: clinical laboratory improvement amendments of 1988 (CLIA) waiver applications for manufacturers of in vitro diagnostic devices. Available at: http://www.fda.gov/MedicalDevices/DeviceRegulationandGuidance/GuidanceDo.... Accessed December 1, 2013.
-
- Krouwer J. Why manufacturers should embrace error grids. Available at: http://www.ivdtechnology.com/article/why-manufacturers-should-embrace-er.... Accessed October 29, 2013.
Publication types
MeSH terms
Substances
Grants and funding
LinkOut - more resources
Full Text Sources
Other Literature Sources
Medical
