The survey of birth defects rate based on birth registration system
- PMID: 25563306
- PMCID: PMC4837823
- DOI: 10.4103/0366-6999.147785
The survey of birth defects rate based on birth registration system
Erratum in
-
Corrigendum: The Survey of Birth Defects Rate Based on Birth Registration System.Chin Med J (Engl). 2016 Sep 5;129(17):2140. doi: 10.4103/0366-6999.189064. Chin Med J (Engl). 2016. PMID: 27569248 Free PMC article.
Abstract
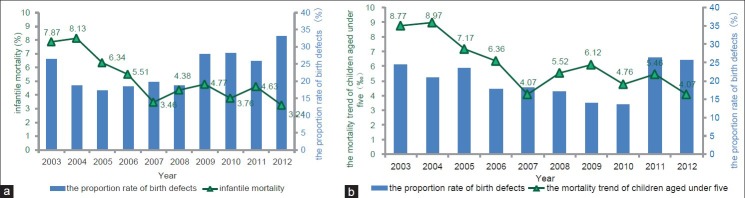
Background: To investigate the surveillance trend of birth defects, incidence, distribution, occurrence regularity, and their relevant factors in Xi'an City in the last 10 years for proposing control measures.
Methods: The birth defects monitoring data of infants during perinatal period (28 weeks of gestation to 7 days after birth) were collected from obstetrics departments of all hospitals during 2003-2012. Microsoft Excel 2003 was used for data input, and Statistical Package for the Social Sciences version 16.0 (International Business Machines Corporation, New York, NY, USA) was used for descriptive analysis. χ2 test, Spearman correlation and linear-by-linear association trend test were used for statistical analyses.
Results: The birth defect rate declined from 9.18% in 2003 to 7.00% in 2012 (χ2 = 45.001, P < 0.01) with a mean value of 7.85%, which is below the Chinese national average level (χ2 = 20.451, P < 0.01). The order of five most common birth defects has changed. The incidence of congenital heart disease (CHD) increased with time, particularly after 2012, it became the most frequent type (r s = 0.808, P < 0.001). Till then, the number of neural tube defects (NTDs) declined significantly (χ2 = 76.254, P < 0.01). The average birth defects rate of 8.11% in rural areas was higher than that in urban areas (7.56%, χ2 = 7.919, P < 0.01) and much higher in males (8.28%) than that in females (7.18%, χ2 = 32.397, P < 0.01). Maternal age older than 35 years (χ2 = 35.298, P < 0.01) is the most dangerous age bracket of birth defects than maternal age younger than 20 years (χ2 = 7.128, P < 0.01).
Conclusions: A downward trend of birth defects was observed in Xi'an City from 2003 to 2012. NTDs significantly decreased after large-scale supplemental folic acid intervention, while the incidence rate of CHD significantly increased.
Conflict of interest statement
Figures
References
-
- Wang FL. Beijing: Publishing Company of Peking Union Medical College and Peking University Health Science Center; 1998. Atlas of Congenital Malformations-Birth Defects Monitored in China.
-
- Yang SQ. Cheng Du: Sichuan Science and Technology Press; 1998. Yang SQ. The monitoring method and seasonal analysis of birth defects.
-
- Zheng W, Fang JQ. Case-control study on influencing factors of birth defects. Pract Prev Med. 2009;16:679–82.
-
- ICBDMS. Roma: ICBDMS; 2002. International Clearinghouse for Birth Defects Monitoring Systems – Annual Report 2002.
-
- ICBDMS. Roma: ICBDMS; 2003. International Clearinghouse for Birth Defects Monitoring Systems – Annual Report 2003.
MeSH terms
LinkOut - more resources
Full Text Sources
Other Literature Sources
Medical