Review
. 2015 Jan 7;9(1):1.
doi: 10.1186/s40246-014-0023-x.

Self-reported race/ethnicity in the age of genomic research: its potential impact on understanding health disparities

Affiliations
Review

Self-reported race/ethnicity in the age of genomic research: its potential impact on understanding health disparities

Tesfaye B Mersha et al. Hum Genomics. .

Erratum in

Abstract

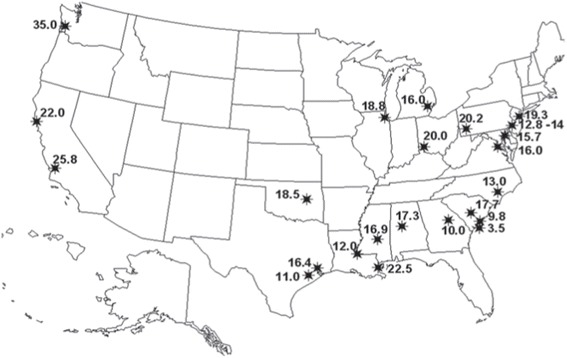
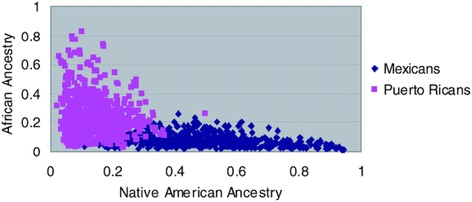
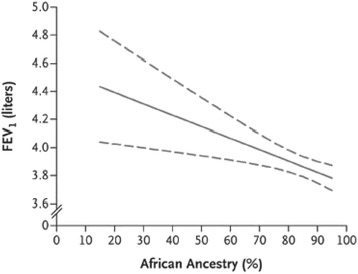
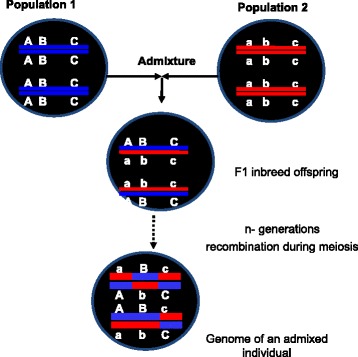
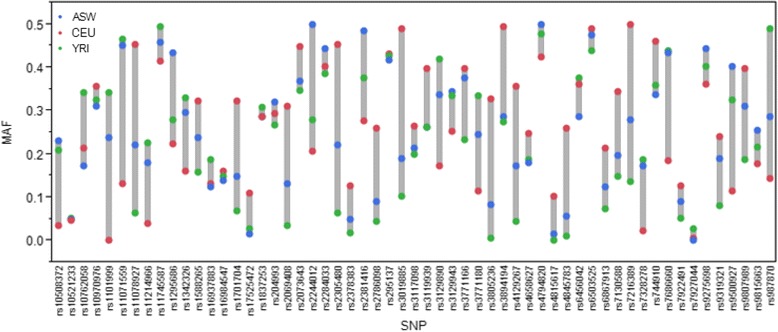
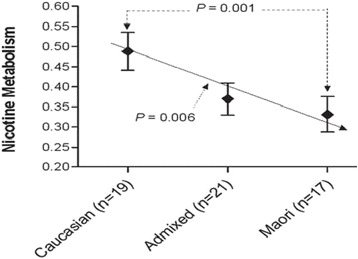
This review explores the limitations of self-reported race, ethnicity, and genetic ancestry in biomedical research. Various terminologies are used to classify human differences in genomic research including race, ethnicity, and ancestry. Although race and ethnicity are related, race refers to a person's physical appearance, such as skin color and eye color. Ethnicity, on the other hand, refers to communality in cultural heritage, language, social practice, traditions, and geopolitical factors. Genetic ancestry inferred using ancestry informative markers (AIMs) is based on genetic/genomic data. Phenotype-based race/ethnicity information and data computed using AIMs often disagree. For example, self-reporting African Americans can have drastically different levels of African or European ancestry. Genetic analysis of individual ancestry shows that some self-identified African Americans have up to 99% of European ancestry, whereas some self-identified European Americans have substantial admixture from African ancestry. Similarly, African ancestry in the Latino population varies between 3% in Mexican Americans to 16% in Puerto Ricans. The implication of this is that, in African American or Latino populations, self-reported ancestry may not be as accurate as direct assessment of individual genomic information in predicting treatment outcomes. To better understand human genetic variation in the context of health disparities, we suggest using "ancestry" (or biogeographical ancestry) to describe actual genetic variation, "race" to describe health disparity in societies characterized by racial categories, and "ethnicity" to describe traditions, lifestyle, diet, and values. We also suggest using ancestry informative markers for precise characterization of individuals' biological ancestry. Understanding the sources of human genetic variation and the causes of health disparities could lead to interventions that would improve the health of all individuals.


Figures

Figure 1
Figure 1
Map showing estimates of the percentage of European contribution to several African American communities throughout the US. The percentage of European contribution to several African American samples within the continental US varies tenfold, from 3.5% in the isolated Gullah-speaking Sea Islanders from South Carolina to 35% in Seattle. Reproduced from Parra [15].
Figure 2
Figure 2
Ancestry proportions of Mexicans vs. Puerto Ricans. Although Mexicans and Puerto Ricans are both considered Latino or Hispanics, Mexicans, on average, have a higher proportion of Native American ancestry (35%–64%) but a lower proportion of African ancestry (3%–5%). Puerto Ricans have lower proportion of Native American ancestry (12%–15%) and higher proportion of African ancestry (18%–25%). Reproduced from Risch et al. [22].
Figure 3
Figure 3
Relationship of African ancestry proportions with lung function in African-American male subjects using ancestry informative markers. An inverse relationship between the percentage of global African ancestry and baseline FEV1 (Forced Expiratory Volume, measured in liters) are shown. Reproduced from Kumar et al. [38].
Figure 4
Figure 4
Schematic representation of genomic mosaicism as a result of ancestral admixture. An admixed individual derived from two founders in several generations of recombination. The chromosomes of the two founders (shown in different colors) are combined by several generations of random mating to produce present day admixed individual. A DNA sequence of any admixed individual is a mosaic of its founders’ DNA segments. A classic example in humans is the African-American population. The two ancestral populations, European and African ancestry, are represented by dark blue and red chromosomes, respectively. Individuals in the subsequent generation may or may not receive an intact chromosome of their ancestor. As generations continue, mosaics develop for chromosomes 1 and 2 as a result of recombination during meiosis. Chromosomal block sizes are expected to decay with the number of generations of admixture. Only those meiotic crossovers that occur at loci where the paired homologous chromosomes have different ancestries will cause ancestry blocks to decay in size and can be detected using ancestry informative markers (AIMs).
Figure 5
Figure 5
Minor allele frequency (MAF) distribution. Asthma-related GWAS SNP’s across African American (ASW), European American (CEU), and African (YRI) populations from the NHGRI GWAS catalog (http://www.genome.gov/gwastudies). The GWAS catalog is an online catalog of SNP trait associations including asthma from published GWAS studies.
Figure 6
Figure 6
Nicotine metabolisms in ancestral and admixed population. Nicotine metabolism was estimated by salivary 3-HC: COT ratio. The X-axis shows population groups with sample size in brackets, and the Y-axis labels the nicotine metabolism. These data provide evidence that a) Maori smokers have significantly (p = 0.001) slower nicotine metabolic rates compared to Caucasian smokers and b) there is a significant linear correlation between nicotine metabolic rate and the degree of Maori ancestry. The admixed population has intermediate nicotine metabolism compared with parental nicotine metabolisms. Reproduced from Lea et al. [93].

References

    1. Lander ES, Linton LM, Birren B, Nusbaum C, Zody MC, Baldwin J, Devon K, Dewar K, Doyle M, FitzHugh W, Funke R, Gage D, Harris K, Heaford A, Howland J, Kann L, Lehoczky J, LeVine R, McEwan P, McKernan K, Meldrim J, Mesirov JP, Miranda C, Morris W, Naylor J, Raymond C, Rosetti M, Santos R, Sheridan A, Sougnez C, et al. Initial sequencing and analysis of the human genome. Nature. 2001;409(6822):860–921. doi: 10.1038/35057062. - DOI - PubMed
    1. Hinds DA, Stuve LL, Nilsen GB, Halperin E, Eskin E, Ballinger DG, Frazer KA, Cox DR. Whole-genome patterns of common DNA variation in three human populations. Science. 2005;307(5712):1072–9. doi: 10.1126/science.1105436. - DOI - PubMed
    1. Buchanan CC, Torstenson ES, Bush WS, Ritchie MD. A comparison of cataloged variation between International HapMap consortium and 1000 Genomes Project data. J Am Med Inform Assoc. 2012;19(2):289–294. doi: 10.1136/amiajnl-2011-000652. - DOI - PMC - PubMed
    1. Baye TM. Inter-chromosomal variation in the pattern of human population genetic structure. Hum Genomics. 2011;5(4):220–240. doi: 10.1186/1479-7364-5-4-220. - DOI - PMC - PubMed
    1. Genomes Project C. Abecasis GR, Auton A, Brooks LD, DePristo MA, Durbin RM, Handsaker RE, Kang HM, Marth GT, McVean GA. An integrated map of genetic variation from 1,092 human genomes. Nature. 2012;491(7422):56–65. doi: 10.1038/nature11632. - DOI - PMC - PubMed

Publication types

Substances