

A novel ecological methodology for constructing ethnic-majority life tables in the absence of individual ethnicity information
- PMID: 25563743
- PMCID: PMC4392229
- DOI: 10.1136/jech-2014-204210
A novel ecological methodology for constructing ethnic-majority life tables in the absence of individual ethnicity information
Abstract
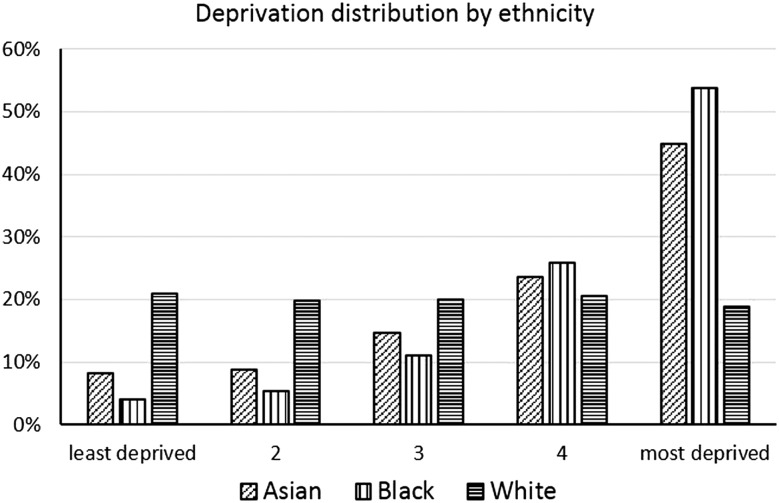
Background: Deprivation-specific life tables have been in use for some time, but health outcomes are also known to vary by ethnicity over and above deprivation. The mortality experiences of ethnic groups are little studied in the UK, however, because ethnicity is not captured on death certificates.
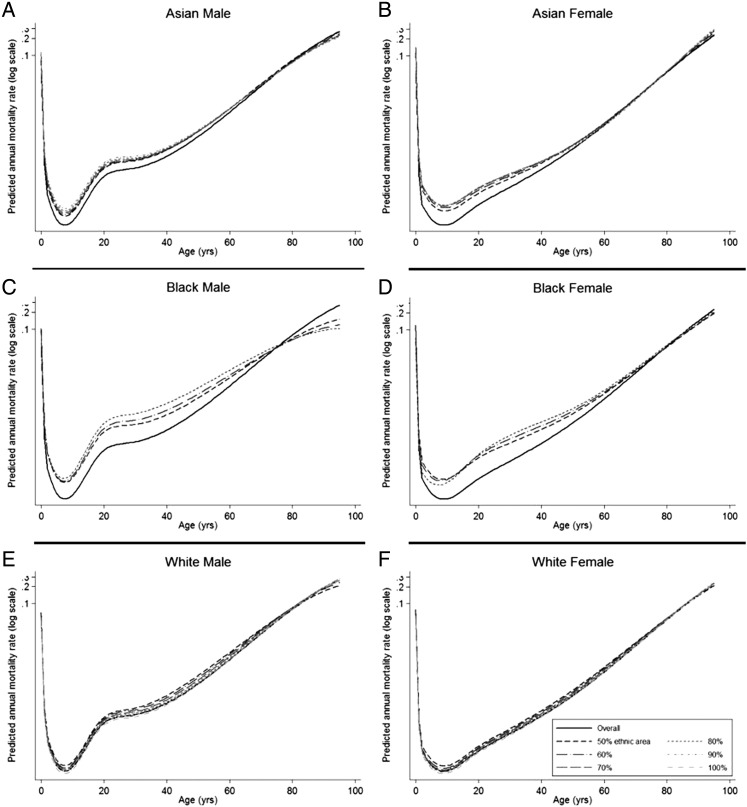
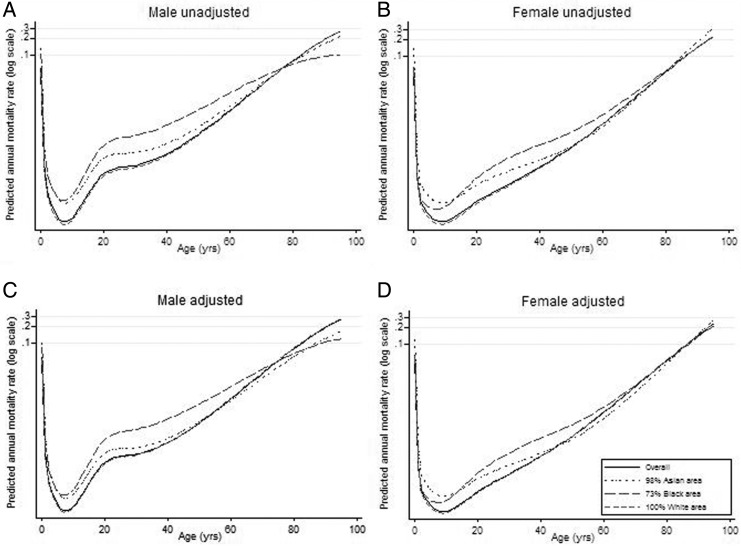
Methods: Population data for all Output Areas (OAs) in England and Wales were stratified by age-group, sex and ethnic proportion, and matched to the deaths counts in that OA from 2000 to 2002. We modelled the relationship between mortality, age, deprivation and ethnic proportion. We predicted mortality rates for an area that contained the maximum proportion of each ethnic group reported in any area in England and Wales, using a generalised linear model with a Poisson distribution adjusted for deprivation.
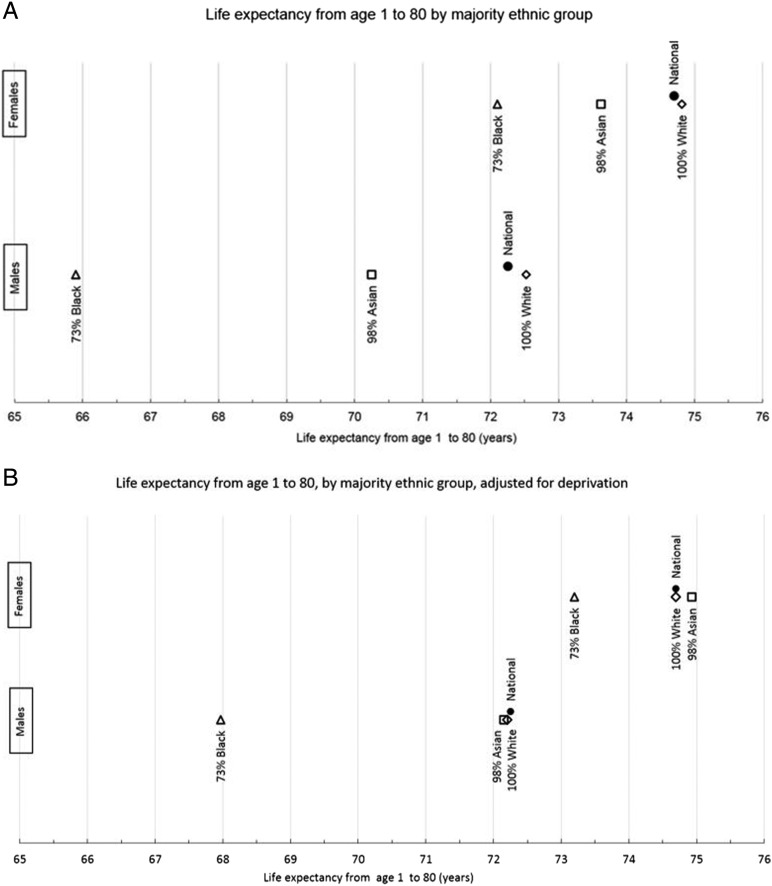
Results: After adjustment, Asian and White life expectancies between 1 and 80 years were very similar. Black men and women had lower life expectancies: men by 4 years and women by around 1.5 years. The Asian population had the lowest mortality of all groups over age 45 in women and over 50 in men, whereas the Black population had the highest rates throughout, except in girls under 15.
Conclusions: We adopted a novel ecological method of constructing ethnic-majority life tables, adjusted for deprivation. There is still diversity within these three broad ethnic groups, but our data show important residual differences in mortality for Black men and women. These ethnic life tables can be used to inform public health planning and correctly account for background mortality in ethnic subgroups of the population.
Keywords: DEMOGRAPHY; EPIDEMIOLOGY; ETHNICITY; Health inequalities; STATISTICS.
Published by the BMJ Publishing Group Limited. For permission to use (where not already granted under a licence) please go to http://group.bmj.com/group/rights-licensing/permissions.
Figures
References
-
- Piachaud D, Bennett F, Nazroo J, et al. . Social Inclusion and Social Mobility. Fair Society Healthy Lives Task Group Report 2009.
-
- Marmot M, Allen J, Bell R, et al. . WHO European review of social determinants of health and the health divide. Lancet 2012;380:1011–29. - PubMed
-
- Marmot M, Bell R. Fair society, healthy lives. Public Health 2012;126(Suppl 1):S4–10. - PubMed
Publication types
MeSH terms
Grants and funding
LinkOut - more resources
Full Text Sources
Other Literature Sources