. 2015 Jan 7:5:7656.
doi: 10.1038/srep07656.

Leader cells regulate collective cell migration via Rac activation in the downstream signaling of integrin β1 and PI3K

Affiliations

Leader cells regulate collective cell migration via Rac activation in the downstream signaling of integrin β1 and PI3K

Naoya Yamaguchi et al. Sci Rep. .

Abstract

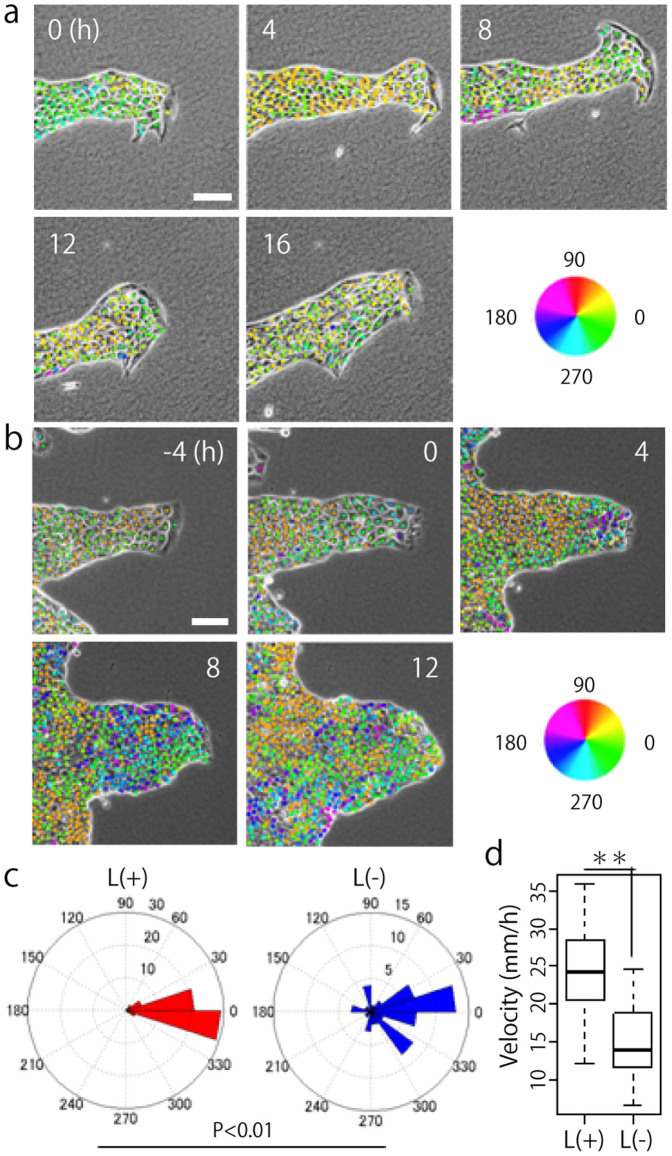
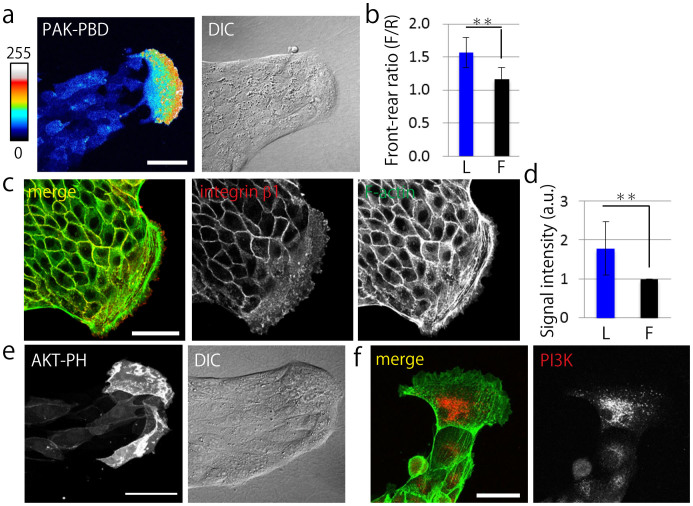
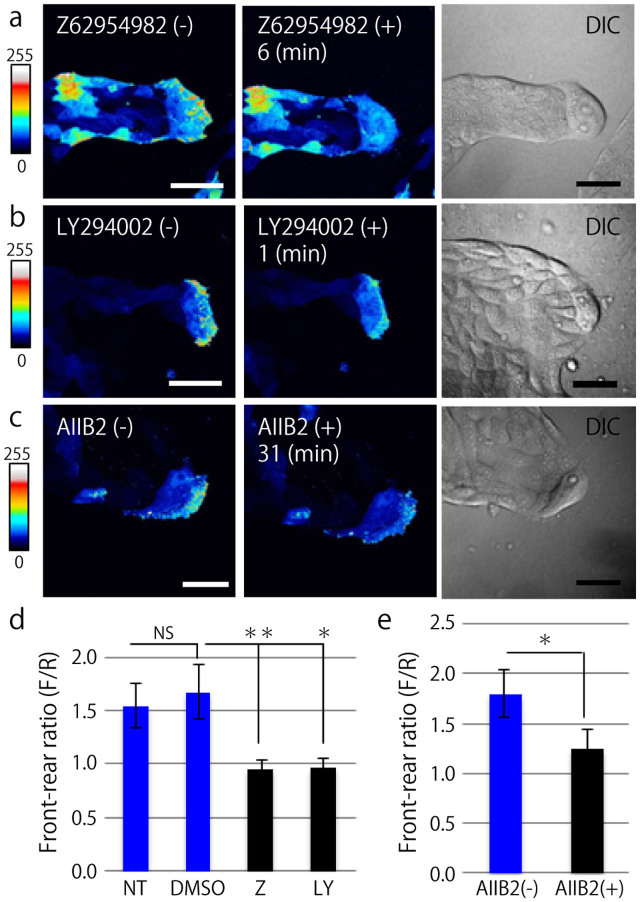
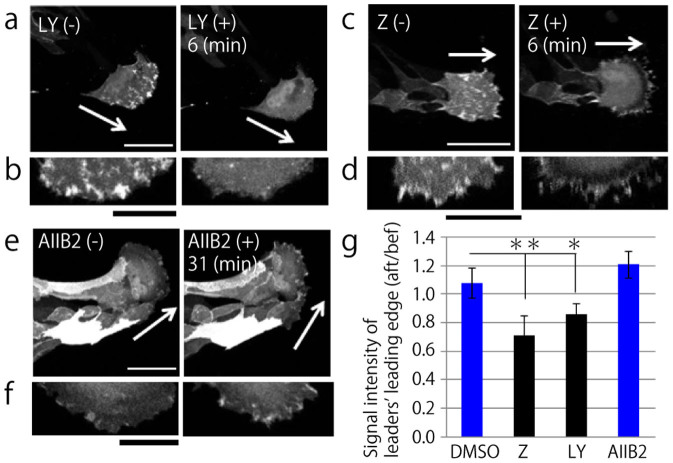
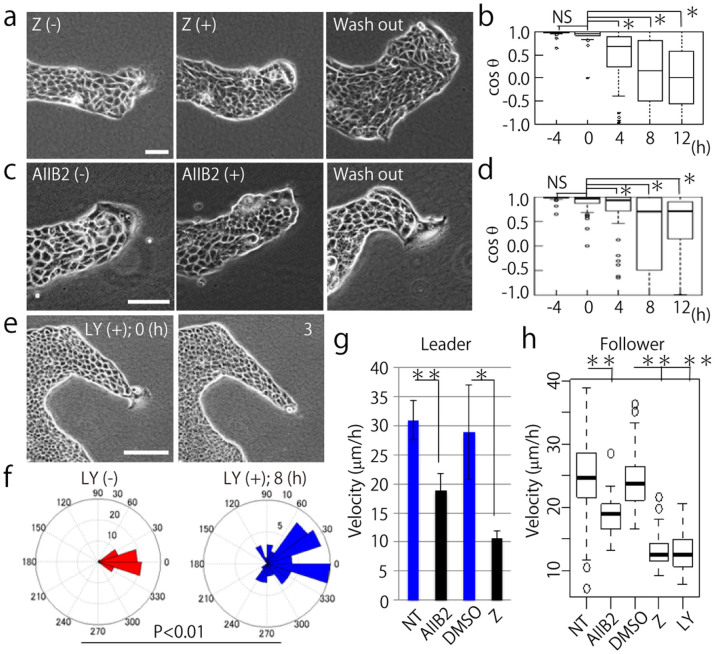
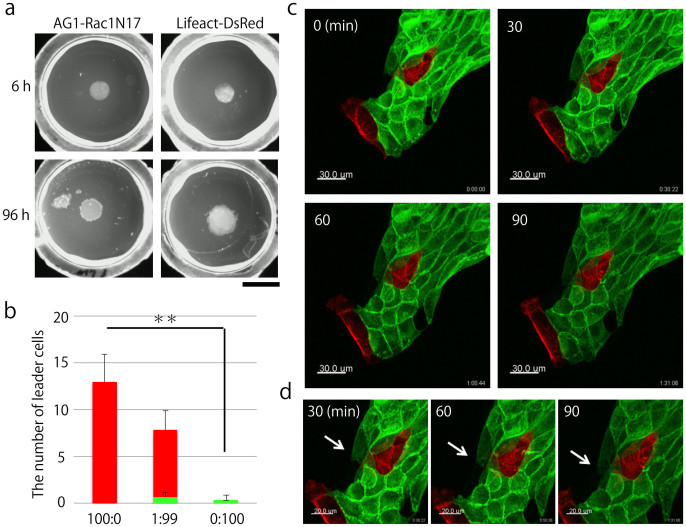
Collective cell migration plays a crucial role in several biological processes, such as embryonic development, wound healing, and cancer metastasis. Here, we focused on collectively migrating Madin-Darby Canine Kidney (MDCK) epithelial cells that follow a leader cell on a collagen gel to clarify the mechanism of collective cell migration. First, we removed a leader cell from the migrating collective with a micromanipulator. This then caused disruption of the cohesive migration of cells that followed in movement, called "follower" cells, which showed the importance of leader cells. Next, we observed localization of active Rac, integrin β1, and PI3K. These molecules were clearly localized in the leading edge of leader cells, but not in follower cells. Live cell imaging using active Rac and active PI3K indicators was performed to elucidate the relationship between Rac, integrin β1, and PI3K. Finally, we demonstrated that the inhibition of these molecules resulted in the disruption of collective migration. Our findings not only demonstrated the significance of a leader cell in collective cell migration, but also showed that Rac, integrin β1, and PI3K are upregulated in leader cells and drive collective cell migration.


Conflict of interest statement

The authors declare no competing financial interests.

Figures

Figure 1
Figure 1. Leader cells play a crucial role in collective migration of MDCK cells.
(a) MDCK cells moving collectively as directed by a leader cell. The migratory direction of each cell is shown by colored dots. (b) The direction of the follower cells moving after removal of the leader cell at 0 h. (a and b) Scale bar: 100 μm. (c) Quantification of migration direction (N = 3). In each experiment, 20 follower cells were manually tracked. L(+): before and L(−): after a leader was killed. P < 0.01 by Watson's two-sample test of homogeneity. (d) Quantification of migratory velocity. **P < 0.01 by Student's t-test. The mean value ± S.D.
Figure 2
Figure 2. Rac, integrin β1, and PI3K are upregulated in leader cells.
(a) Fluorescent image of the typical finger-like structure exhibited by MDCK cells expressing PAK-PBD-AcGFP. DIC: Differential interference contrast image. Fluorescent intensity is represented with colors from hot to cold. (b) Quantification of the ratio of the mean fluorescent intensity of PAK-PBD-AcGFP determined in a region of the leading front (F) divided by the signal intensity of the trailing rear (R) (N = 15). (c) Fluorescent images of integrin β1 stained by AIIB2. Red: integrin β1. Green: F-actin. (d) Quantification of the fluorescent intensity of integrin β1 at the bottom of cells. L: leader cells, F: follower cells. The signal intensity of leader cells was normalized by that of the follower cells (N = 8). (e) Fluorescent images of collectively migrating MDCK cells expressing AKT-PH-GFP. (f) Fluorescent images of PI3K. Green: F-actin, Red: PI3K. (a, c, e, and f) Scale bars: 50 μm. (b and d) The mean value ± S.D. **P < 0.01 by Student's t-test.
Figure 3
Figure 3. Rac in a leader cell is regulated by PI3K and integrin β1.
(a, b, and c) Representative images of MDCK cells expressing PAK-PBD-AcGFP before (left) and after inhibitor treatment (center). The right panels show the DIC images before inhibitor treatment. Scale bars: 50 μm. (a) Z62954982 (Rac1 inhibitor, 100 μM). (b) LY294002 (PI3K inhibitor, 10 μM). (c) AIIB2 (integrin β1 inhibitory antibody, 1.5 μg/ml). (d) Quantification of the ratio of the mean fluorescent signal of PAK-PBD-AcGFP determined in the leading front area (F) divided by the fluorescent intensity of the trailing rear (R). NT: before inhibitor treatment (non-treated), DMSO: negative control, Z: 6 min after treatment of Z62954982, LY: 1 min after treatment of LY294002 (at least N = 3). (e) Quantification of the front-rear signal intensity ratio of MDCK cells expressing PAK-PBD-AcGFP before (AIIB2(−)) and 31 min after (AIIB2(+)) AIIB2 treatment (N = 3). (d and e) The mean value ± S.D. NS: non-significant, **P < 0.01, *P < 0.05 by Student's t-test.
Figure 4
Figure 4. PI3K in a leader cell is also regulated by Rac1 but not by integrin β1.
(a, c, and e) Images obtained by live imaging of MDCK cells expressing AKT-PH-GFP, before inhibitor treatment (left panel) and after inhibitor treatment (right panel). Scale bars: 50 μm. (a) LY294002 (PI3K inhibitor, 10 μM). (c) Z62954982 (Rac1 inhibitor, 100 μM). (e) AIIB2 (integrin β1 inhibitory antibody, 1.5 μg/ml). (b, d, and f) Magnified images of the leading edges in a leader cell are shown (a, c, and e, respectively). Left: before inhibitor treatment, right: after inhibitor added. Scale bars: 25 μm. (g) Quantification of the ratio of the mean fluorescent intensity of AKT-PH-GFP described in the leading front area after the inhibitor was added (aft) divided by the fluorescent intensity of the same region before inhibitor treatment (bef). DMSO: negative control, Z: 6 min after Z62954982 treatment, LY: 6 min after LY294002, AIIB2: 31 min after AIIB2 treatment. **P < 0.01, *P < 0.05 by Student's t-test. The mean value ± S.D.
Figure 5
Figure 5. Inhibition of Rac1, integrin β1, and PI3K disrupts collective migration of MDCK cells.
(a, c, and e) Time-lapse phase contrast images of migrating MDCK cells. (−) indicates before and (+) represents after inhibition. (a) Rac1 inhibition with Z62954982 (100 μM). (c) integrin β1 inhibition with AIIB2 (1.5 μg/ml). (e) PI3K inhibition with LY294002 (10 μM). Wash out means washing or removal of the inhibitor with fresh medium. Scale bars: 100 μm. (b and d) The angles between the migration direction of leader cells and follower cells treated with inhibitors are shown by cosθ. (b) Z62954982 (100 μM) and (d) AIIB2 (1.5 μg/ml) was treated at time 0. NS: non-significant, *P < 0.01 by Wilcoxon rank sum test. Twenty follower cells were randomly chosen in each experiment (N = 3). The mean value ± S.D. (f) Migratory direction of follower cells before and after PI3K inhibitor treatment. Twenty follower cells were analyzed from each experiment (N = 3). NS: non-significant, *P < 0.01 by Watson's two-sample test of homogeneity. (g) The migration velocity of leader cells under inhibitor treatment. NT: before treatment. AIIB2: integrin β1 inhibitor (1.5 μg/ml), DMSO: negative control, Z: Rac1 inhibitor (Z62954982, 100 μM) (at least N = 3). **P < 0.01, *P < 0.05. The mean value ± S.D. (h) The migration velocity of follower cells with each inhibitor. The inhibitor concentrations were the same as (g), and the PI3K inhibitor (LY294002) concentration used was 10 μM. Twenty follower cells were randomly chosen from 1 image (N = 3). **P < 0.01. The mean value ± S.D.
Figure 6
Figure 6. Activation of Rac1 in leader cells, but not in follower cells, is crucial for collective migration.
(a) Expansion of MDCK AG1-Rac1N17 and MDCK Lifeact-DsRed cells cultured on collagen gels. Upper panels show the colony morphologies observed immediately after the rings were removed, while lower panels show the morphologies observed 96 h after the rings were removed. Bar: 1 cm. (b) The number of leader cells, each distinguished by a different color. Red represents MDCK Lifeact-DsRed cells and green represents MDCK AG1-Rac1N17 cells. MDCK Lifeact-DsRed and MDCK AG1-Rac1N17 cells were mixed at the following ratios: 100:0 (N = 4), 1:99 (N = 6), and 0:100 (N = 6). The number of total seeded cells was 105 cells. **P < 0.01 by Welch's t-test. Results are shown as mean value ± S.D. (c) Live cell imaging of mixed culture cells at the following ratio: MDCK Lifeact-DsRed cells:MDCK AG1-Rac1N17 cells = 1:99. The number of total seeded cells was 105 cells. Bar: 30 μm. (d) Magnified images of (c). Arrows indicate an elongating follower cell expressing AG1-Rac1N17. Bar: 30 μm.

References

    1. Friedl P. & Gilmour D. Collective cell migration in morphogenesis, regeneration and cancer. Nat Rev Mol Cell Biol 10, 445–57 (2009). - PubMed
    1. Friedl P., Hegerfeldt Y. & Tusch M. Collective cell migration in morphogenesis and cancer. Int J Dev Biol 48, 441–9 (2004). - PubMed
    1. Rorth P. Collective cell migration. Annu Rev Cell Dev Biol 25, 407–29 (2009). - PubMed
    1. Cheung K. J., Gabrielson E., Werb Z. & Ewald A. J. Collective invasion in breast cancer requires a conserved Basal epithelial program. Cell 155, 1639–51 (2013). - PMC - PubMed
    1. Haga H., Irahara C., Kobayashi R., Nakagaki T. & Kawabata K. Collective movement of epithelial cells on a collagen gel substrate. Biophys J 88, 2250–6 (2005). - PMC - PubMed

Publication types

MeSH terms