

HIV controllers with different viral load cutoff levels have distinct virologic and immunologic profiles
- PMID: 25564106
- PMCID: PMC4334695
- DOI: 10.1097/QAI.0000000000000500
HIV controllers with different viral load cutoff levels have distinct virologic and immunologic profiles
Abstract
Background: The mechanisms behind natural control of HIV replication are still unclear, and several studies pointed that elite controllers (ECs) are a heterogeneous group.
Methods: We performed analyses of virologic, genetic, and immunologic parameters of HIV-1 controllers groups: (1) ECs (viral load, <80 copies/mL); (2) ebbing elite controllers (EECs; transient viremia/blips); and viremic controllers (VCs; detectable viremia, <5000 copies/mL). Untreated noncontrollers (NCs), patients under suppressive highly active antiretroviral therapy (HAART), and HIV-1-negative individuals were analyzed as controls.
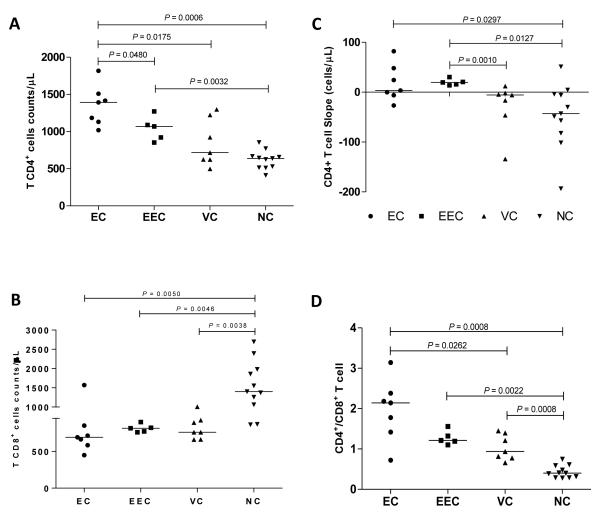
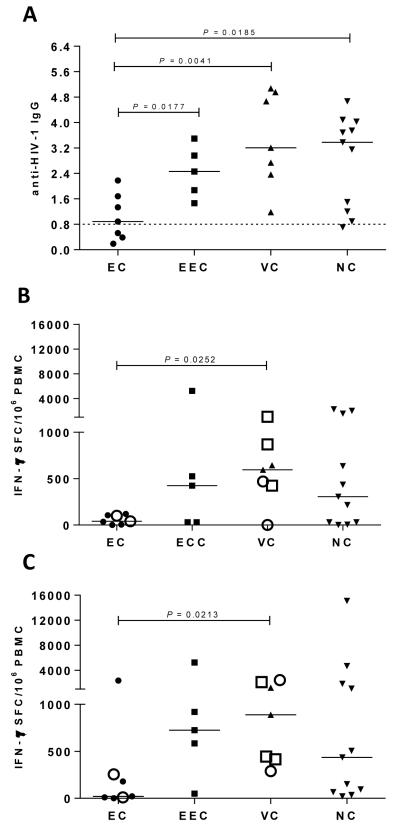
Results: Total and integrated HIV-1 DNA for EC were significantly lower than for NC and HAART groups. 2-LTR circles were detected in EEC (3/5) and VC (6/7) but not in EC. Although EC and EEC maintain normal T-cell counts over time, some VC displayed negative CD4 T-cell slopes. VC and EEC showed a higher percentage of activated CD8 T cells and microbial translocation than HIV-1-negative controls. EC displayed a weaker Gag/Nef IFN-γ T-cell response and a significantly lower proportion of anti-HIV IgG antibodies than EEC, VC, and NC groups.
Conclusion: Transient/persistent low-level viremia in HIV controllers may have an impact on immunologic and virologic profiles. Classified HIV controller patients taking into account their virologic profile may decrease the heterogeneity of HIV controllers cohorts, which may help to clarify the mechanisms associated to the elite control of HIV.
Figures


References
-
- Madec Y, Boufassa F, Porter K, Meyer L. Spontaneous control of viral load and CD4 cell count progression among HIV-1 seroconverters. AIDS. 2005;19(17):2001–2007. - PubMed
-
- Okulicz JF, Marconi VC, Landrum ML, et al. Clinical outcomes of elite controllers, viremic controllers, and long-term nonprogressors in the US Department of Defense HIV natural history study. J Infect Dis. 2009;200(11):1714–1723. - PubMed
-
- Lambotte O, Boufassa F, Madec Y, et al. HIV controllers: a homogeneous group of HIV-1-infected patients with spontaneous control of viral replication. Clin Infect Dis. 2005;41(7):1053–1056. - PubMed
-
- Pereyra F, Addo MM, Kaufmann DE, et al. Genetic and immunologic heterogeneity among persons who control HIV infection in the absence of therapy. J Infect Dis. 2008;197(4):563–571. - PubMed
Publication types
MeSH terms
Grants and funding
LinkOut - more resources
Full Text Sources
Medical
Research Materials
