. 2015 Jan 6;56(1):625-32.
doi: 10.1167/iovs.14-14757.

The contrast sensitivity of the newborn human infant

Affiliations

The contrast sensitivity of the newborn human infant

Angela M Brown et al. Invest Ophthalmol Vis Sci. .

Abstract

Purpose: To measure the binocular contrast sensitivity (CS) of newborn infants using a fixation-and-following card procedure.

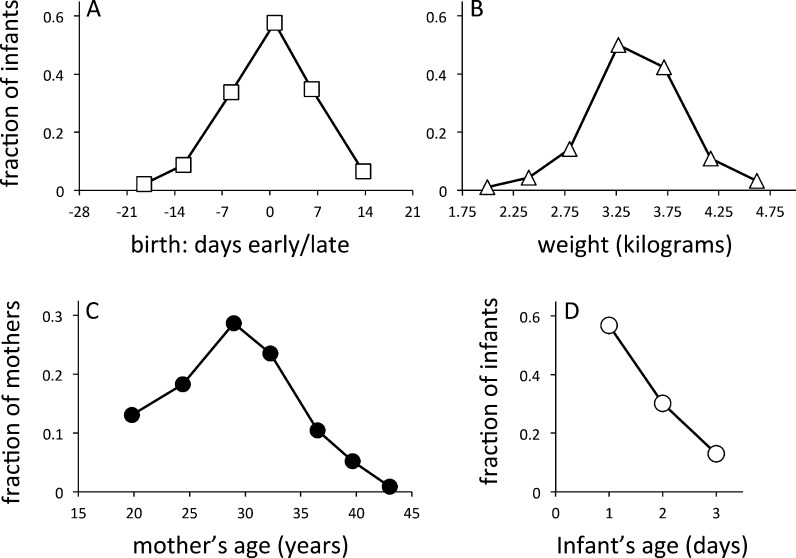
Methods: The CS of 119 healthy newborn infants was measured using stimuli printed on cards under the descending method of limits (93 infants) and randomized/masked designs (26 infants). One experienced and one novice adult observer tested the infants using vertical square-wave gratings (0.06 and 0.10 cyc/deg; 20/10,000 and 20/6000 nominal Snellen equivalent); the experienced observer also tested using horizontal gratings (0.10 cyc/deg) and using the Method of Constant Stimuli while being kept unaware of the stimulus values.

Results: The CS of the newborn infant was 2.0 (contrast threshold = 0.497; 95% confidence interval: 0.475-0.524) for vertically oriented gratings and 1.74 (threshold = 0.575; 95% confidence interval: 0.523-0.633) for horizontally oriented gratings (P < 0.0006). The standard deviation of infant CS was comparable to that obtained by others on adults using the Pelli-Robson chart. The two observers showed similar practice effects. Randomization of stimulus order and masking of the adult observer had no effect on CS.

Conclusions: The CS of individual newborn human infants can be measured using a fixation-and-following card procedure.

Keywords: card procedure; contrast sensitivity; fixation-and-following; neonatal; newborn.


Figures

Figure 1.
Figure 1.
Adult CSFs. (A) steady square waves (small red squares), single edge (large red square), and steady sine waves (blue diamonds, after Ref. 3). (B) flickering sine wave (after Ref. 2).
Figure 2.
Figure 2.
Stimuli, at 0.96 contrast. (A, B) vertical stimuli (experiment I); (C, D) horizontal stimuli (experiment II). The grating in (C) is identical to the grating in (A) except for 90° rotation.
Figure 3.
Figure 3.
Fourier spectra of 0.96 contrast gratings. (AD) the first 20 Fourier components, in two dimensions, keyed to the corresponding stimuli shown in Figures 1A through 1D. (E) Fourier spectra of the modulation in the horizontal direction (arrows in [A, B]) in the vertical gratings in experiment I. (F) Fourier spectra of the modulation in the horizontal direction of the main Fourier components (arrows in [C, D]) in the horizontal gratings in experiment II.
Figure 4.
Figure 4.
Mothers' ages and ages and weights of the infants, across all three experiments.
Figure 5.
Figure 5.
Results of experiment I. (A) average newborn CS and threshold ± SEM for two observers and two spatial frequencies. (B, C) Contrast sensitivities and thresholds improved for both testers as they gained experience (linear regression lines).
Figure 6.
Figure 6.
Tests with 0.1 cyc/deg stimuli, as a function of test order. Observer AMB. Elbow functions fitted by least-squares criterion. A, vertical gratings. White disks: experiment I, first tests only; gray disks: experiment II, vertical stimuli tested in conjunction with the sharp-edged (dark gray) and blurred-edged (light gray) horizontal gratings; black disks: experiment III, random/masked experimental design. (B) Experiment II, horizontal gratings; (C) The ratio between the data from B and A. Gray-level coding in B and C as in A. Xs: missing data on two infants who failed to see any horizontal grating. Squares: median of the data over the constant parts of the functions, including the missing data.
Figure 7.
Figure 7.
Data from experiments II and III, measured using 0.10 cyc/deg. (A) CS values. NA: infants saw the 0.96 contrast vertical grating, but fell asleep before seeing any other gratings. The standard deviation of the data measured with vertical gratings was 0.097, which is comparable to that of adults measured with the Pelli-Robson chart., (B) Distribution of CS ratios across infants from experiment II. NA, no ratio available because no horizontal gratings were seen.
Figure 8.
Figure 8.
Adult CSFs fitted to infant data. Disks, infant CS data, vertical gratings (black disks, experiment I; white disks, experiments II, III; standard error bars smaller than the symbols). Diamonds, mean newborn visual acuity from the literature. Curves, fits of adult data from Figure 1. (A) Adult square-wave and sine-wave CSFs, steady presentation. (B) Adult sine-wave CSF curve, flickered presentation.

References

    1. Brodsky MC. The apparently blind infant. In: Brodsky MC. ed Pediatric Neuro-ophthalmology. New York: Springer; 2010: 1–58.
    1. Robson JG. Spatial and temporal contrast sensitivity functions of the visual system. J Opt Soc Am. 1966; 56: 1141–11 42.
    1. Campbell FW, Howell ER, Johnstone JR. A comparison of threshold and suprathreshold appearance of gratings with components in the low and high spatial frequency range. J Physiol. 1978; 284: 193–201. - PMC - PubMed
    1. Campbell FW, Robson JG. Application of Fourier analysis to the visibility of gratings. J Physiol. 1968; 197: 551–5 66. - PMC - PubMed
    1. Kulikowski JJ, Tolhurst DJ. Psychophysical evidence for sustained and transient detectors in human vision. J Physiol. 1973; 232: 149–1 62. - PMC - PubMed

Publication types

LinkOut - more resources