. 2015 Jan;138(Pt 1):120-35.
doi: 10.1093/brain/awu375.

Gain of Olig2 function in oligodendrocyte progenitors promotes remyelination

Affiliations

Gain of Olig2 function in oligodendrocyte progenitors promotes remyelination

Amélie Wegener et al. Brain. 2015 Jan.

Abstract

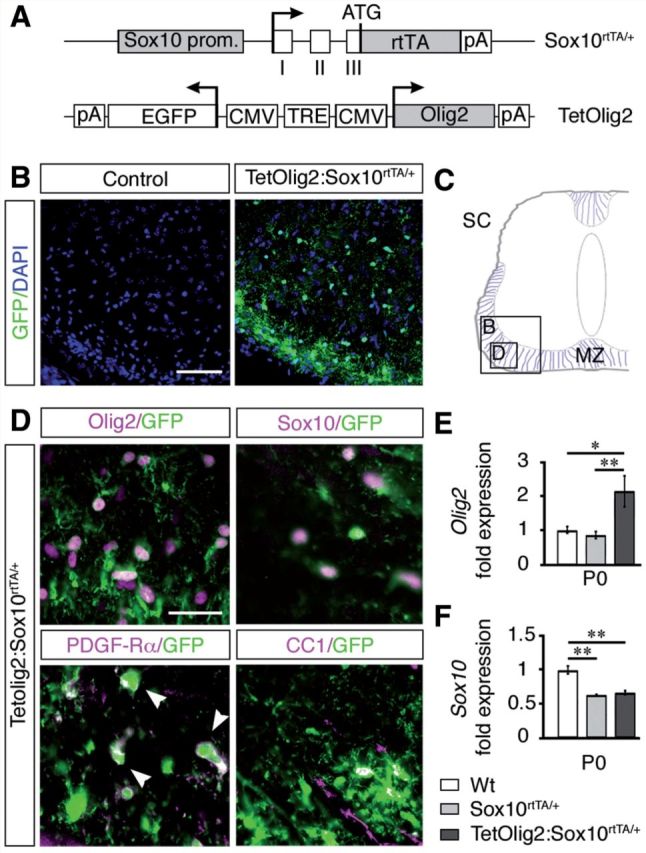
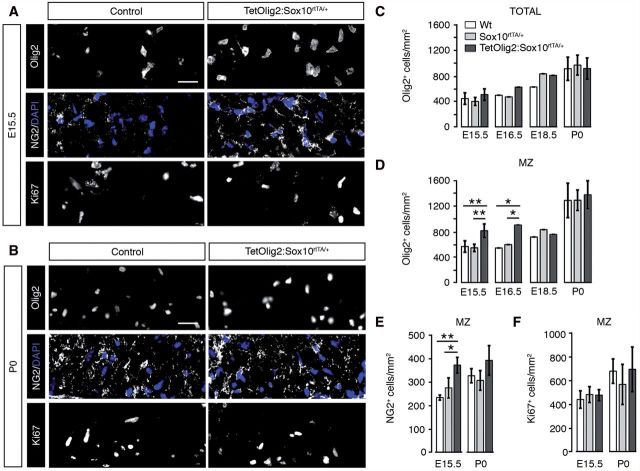
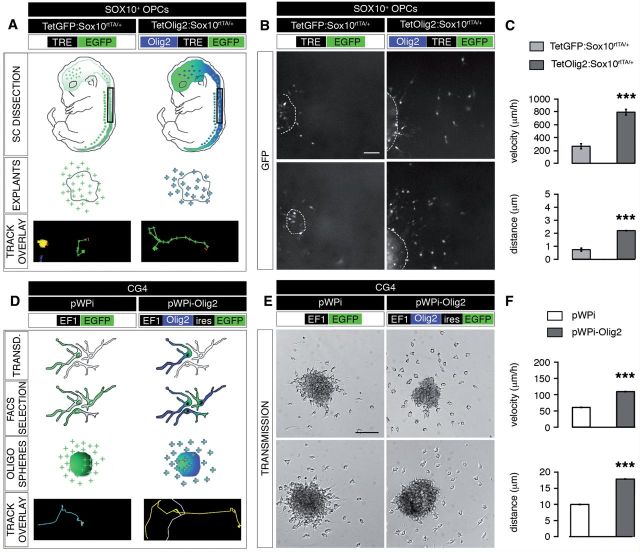
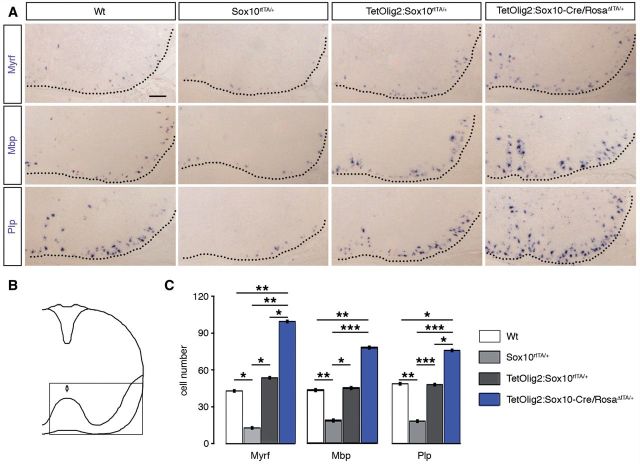
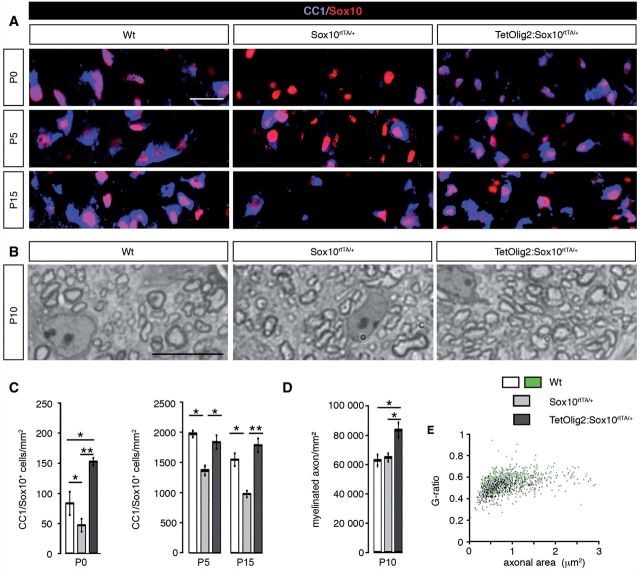
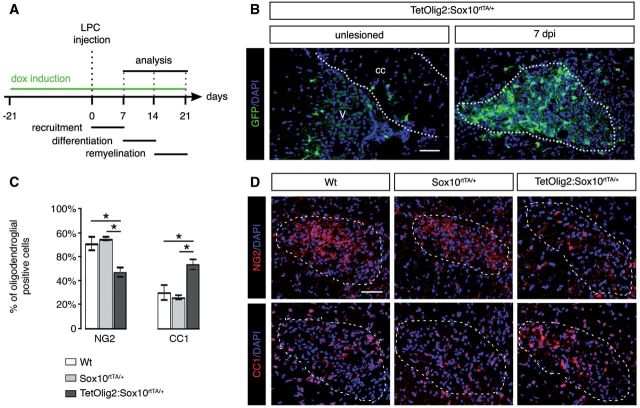
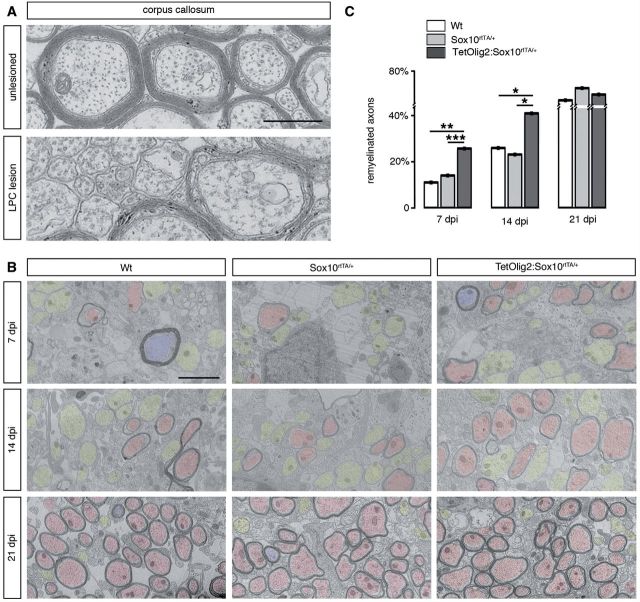
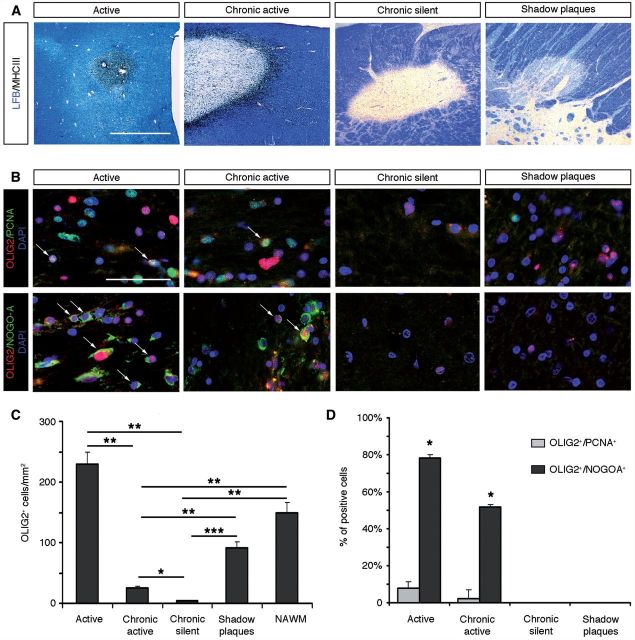
The basic helix-loop-helix transcription factor Olig2 is a key determinant for the specification of neural precursor cells into oligodendrocyte progenitor cells. However, the functional role of Olig2 in oligodendrocyte migration and differentiation remains elusive both during developmental myelination and under demyelinating conditions of the adult central nervous system. To decipher Olig2 functions, we generated transgenic mice (TetOlig2:Sox10(rtTA/+)) overexpressing Olig2 in Sox10(+) oligodendroglial cells in a doxycycline inducible manner. We show that Olig2 overexpression increases the generation of differentiated oligodendrocytes, leading to precocious myelination of the central nervous system. Unexpectedly, we found that gain of Olig2 function in oligodendrocyte progenitor cells enhances their migration rate. To determine whether Olig2 overexpression in adult oligodendrocyte progenitor cells promotes oligodendrocyte regeneration for myelin repair, we induced lysophosphatidylcholine demyelination in the corpus callosum of TetOlig2:Sox10(rtTA/+) and control mice. We found that Olig2 overexpression enhanced oligodendrocyte progenitor cell differentiation and remyelination. To assess the relevance of these findings in demyelinating diseases, we also examined OLIG2 expression in multiple sclerosis lesions. We demonstrate that OLIG2 displays a differential expression pattern in multiple sclerosis lesions that correlates with lesion activity. Strikingly, OLIG2 was predominantly detected in NOGO-A(+) (now known as RTN4-A) maturing oligodendrocytes, which prevailed in active lesion borders, rather than chronic silent and shadow plaques. Taken together, our data provide proof of principle indicating that OLIG2 overexpression in oligodendrocyte progenitor cells might be a possible therapeutic mechanism for enhancing myelin repair.

Keywords: Olig2; multiple sclerosis; oligodendrocyte; remyelination; tetracycline system.


Figures

Figure 1
Figure 1
Generation of TetOlig2:Sox10rtTA/+ mouse line. (A) Schematic representation of Sox10rtTA/+ and TetOlig2 alleles that together induce Olig2 overexpression in Sox10+ cells upon doxycycline treatment. Sox10 prom = Sox10 promoter region; open boxes = exons I–III of the Sox10 gene; rtTA = coding sequences for the reverse tetracycline-controlled transactivator; pA = polyadenylation sites; TRE = tetracycline responsive element; CMV = minimal promoter of cytomegalovirus immediate early genes; Olig2 = coding sequence of the Olig2 gene; EGFP = coding sequence of the enhanced green fluorescent protein; ATG = start codon of the Sox10 gene. Arrows indicate transcription starts. (B) GFP immunohistochemistry (green) in control (wild-type or Sox10rtTA/+) and TetOlig2:Sox10rtTA/+ spinal cord at P0. Sections are counterstained with DAPI (blue). Note that GFP was only detected in TetOlig2:Sox10rtTA/+ mice. (C) Schematic representation of the spinal cord (SC) illustrating the marginal zone (MZ) and regions shown in B and D (open boxes). (D) Immunolabellings for GFP (green), Olig2, Sox10, PDGFRA and CC1 (all in red) on spinal cord sections of TetOlig2:Sox10rtTA/+. GFP was detected in Olig2+, Sox10+, PDGFRA+ and CC1+ oligodendroglial cells. (E and F) Quantitative reverse transcriptase PCR for Olig2 and Sox10 (at least n = 3 for each genotype). (E) In P0 TetOlig2:Sox10rtTA/+ mice (dark grey bars), Olig2 expression was significantly increased with respect to wild-type (Wt) (white bars, P = 0.012) and Sox10rtTA/+ littermates (light grey bars, P = 0.009). (F) Sox10 expression level was reduced by half in Sox10rtTA/+ and TetOlig2:Sox10rtTA/+ with respect to wild-type (P = 0.002 and P = 0.0017, respectively). Scale bars: B = 75 µm; D = 20 µm.
Figure 2
Figure 2
Targeted Olig2 overexpression leads to a transient increase of OPCs in the marginal zone. (A and B) Immunohistochemistry for Olig2, NG2 and Ki67 (grey) on spinal cord sections of control (wild-type and Sox10rtTA/+) and TetOlig2:Sox10rtTA/+ embryos at E15.5 (A) and P0 (B). A and B show areas of the marginal zone (MZ). NG2 labelling is shown in combination with DAPI to visualize cells by their nuclei. (CF) Quantifications of Olig2+ oligodendroglial cells, NG2+ OPCs and Ki67+ cells in the whole spinal cord and in the marginal zone (n ≥ 3 for each genotype). (C) At all time points, the overall density of Olig2+ cells in the spinal cord was not affected in the analysed genotypes. (D) At E15.5 and E16.5, the density of Olig2+ cells was significantly increased in marginal zone of the TetOlig2:Sox10rtTA/+ mice (dark grey bars) with respect to wild-type (white bars, PE15.5 = 0.006, PE16.5 = 0.0084) and Sox10rtTA/+ mice (light grey bars, PE15.5 = 0.007, PE16.5 = 0.0084). (E) The density of NG2+ OPCs was also increased at E15.5 in the marginal zone of TetOlig2:Sox10rtTA/+ compared to wild-type (P = 0.008) and Sox10rtTA/+ (P = 0.031). Differences in Olig2+ or NG2+ OPC density were no longer observed at E18.5 and P0 (D and E). (F) The density of Ki67+ proliferative cells was similar in all genetic strains at E15.5 and P0. Scale bars = 20 µm. Wt = wild-type.
Figure 3
Figure 3
Olig2 overexpression enhances OPC migration in in vitro assays. (A) Schematic representation of the generation and analysis of E13.5 spinal cord (SC) explants for migration studies. Spinal cord explants from doxycycline-induced TetGFP:Sox10rtTA/+ (control) and TetOlig2:Sox10rtTA/+ embryos were dissected and the migration of GFP+ cells was monitored by time-lapse video-microscopy over 24 h. An example of a tracked cell is shown as ‘track overlay’. (B) Representative views of spinal cord explants (dash lines) illustrating the migration of GFP+ OPCs in control and TetOlig2:Sox10rtTA/+ strains after 24 h. (C) The velocity and the migration distance of GFP+ cells were significantly higher in TetOlig2:Sox10rtTA/+ (dark grey bars) with respect to control (light grey bars, P < 0.001). (D) Schematic representation of the generation of oligospheres from transduced CG4 cells for migration assays. Transduction was with pWPi (control) or pWPi-Olig2 lentivirus. (E) Bright field views of pWPi and pWPi-Olig2-transduced oligospheres, 6 h after plating. (F) The velocity and the distance of CG4 cells was significantly increased under Olig2 overexpression conditions (compare dark grey bars to white control bars, P < 0.001). Scale bars: B = 50 µm; E = 100 µm.
Figure 4
Figure 4
Gain of Olig2 function in OPCs leads to their precocious differentiation during embryonic development. (A) In situ hybridization for Myrf, Mbp and Plp1 on E18.5 spinal cord sections from wild-type, Sox10rtTA/+, TetOlig2:Sox10rtTA/+ and TetOlig2:Sox10-Cre/RosaΔtTA/+. Wild-type, Sox10rtTA/+ and TetOlig2:Sox10rtTA/+ were doxycycline treated from E10.5 to E18.5. (B) Schematic representation of the spinal cord indicating the region illustrated in A. (C) The number of Myrf+, Mbp+ and Plp+ cells was significantly decreased in Sox10rtTA/+ mice (light grey bars) with respect to wild-type (white bars, PMyrf = 0.031, PMbp = 0.0017, PPlp1 = 0.005), TetOlig2:Sox10rtTA/+ mice (dark grey bars, PMyrf = 0.046, PMbp = 0.0202, PPlp1 < 0.001) and TetOlig2:Sox10-Cre/RosaΔtTA/+ mice (blue bars, PMyrf = 0.002, PMbp < 0.001, PPlp1 < 0.001). The number of Myrf+, Mbp+ and Plp+ cells was also significantly increased in TetOlig2:Sox10-Cre/RosaΔtTA/+ with respect to wild-type (PMyrf = 0.0047, PMbp = 0.0076, PPlp1 = 0.0117) and TetOlig2:Sox10rtTA/+ for Myrf+ and Plp+ cells (PMyrf = 0.0382, PPlp1 = 0.0228). At least three animals were quantified for each genotype. Scale bar = 100 µm. Wt = wild-type.
Figure 5
Figure 5
Gain of Olig2 function in OPCs induces advanced myelination. (A) The marginal zone of wild-type, Sox10rtTA/+ and TetOlig2:Sox10rtTA/+ spinal cord sections was stained with CC1 (blue) and anti-Sox10 (red) antibodies at P0, P5 and P15. (B) Toluidine blue semi-thin sections of wild-type, Sox10rtTA/+ and TetOlig2:Sox10rtTA/+ spinal cord at P10. (C) The number of CC1+/Sox10+ cells was significantly reduced in Sox10rtTA/+ mice (light grey bars) compared to wild-type (white bars, PP0 = 0.02, PP5 = 0.03, PP15 = 0.041) at all postnatal stages analysed. This oligodendroglial differentiation delay was rescued in TetOlig2:Sox10rtTA/+ bigenic mice (dark grey bars, PP0 = 0.001, PP5 = 0.036, PP15 = 0.006) at all stages. Note that the number of CC1+ cells was significantly higher in TetOlig2:Sox10rtTA/+ as in wild-type (Wt) at P0 (P = 0.036). (D) The density of myelinated fibres was significantly increased in TetOlig2:Sox10rtTA/+ compared with Sox10rtTA/+ and wild-type (P = 0.016, P = 0.0056, respectively). (E) G-ratio was comparable to wild-type (green) in all mutant genotypes; n ≥ 3 for each genotype. Scale bars = 20 µm.
Figure 6
Figure 6
Olig2 overexpression enhances OPC differentiation in LPC lesions. (A) Time schedule of doxycycline induction and histological analysis in the LPC lesion paradigm. Histological analyses were performed after demyelination of the corpus callosum at 7, 14 and 21 days post-injection. (B) Sagittal sections through corpus callosum (cc) and lateral ventricle (v) were labelled for GFP and counterstained with DAPI in unlesioned and lesioned TetOlig2:Sox10rtTA/+ mice at 7 days post-injection (dpi). (C) Quantification of NG2+ OPCs and CC1+ oligodendrocytes at 7 days post-injection in lesions. The density of NG2+ OPCs was significantly reduced in TetOlig2:Sox10rtTA/+ mice (dark grey bars) compared to wild-type (white bars) and Sox10rtTA/+ mice (light grey bars, P < 0.05), while the density of CC1+ oligodendrocytes was increased (P < 0.05, D). (D) LPC lesions of TetOlig2:Sox10rtTA/+ were stained for NG2 and CC1 at 7 days post-injection, and counterstained with DAPI. Dashed lines in panels B and D delineate corpus callosum or lesion areas. Scale bars = 100 µm. dpi = days post-injection.
Figure 7
Figure 7
Gain of Olig2 function in adult OPCs accelerates remyelination. (A) Electronic micrographs of unlesioned and LPC demyelinated corpus callosum. In unlesioned corpus callosum, axons of small calibres are unmyelinated. In demyelinated lesions, remyelinated axons are characterized by a thin myelin sheath. (B) Quantification of remyelinated axons in lesions of doxycycline treated wild-type (white bars), Sox10rtTA/+ (light grey bars) and TetOlig2:Sox10rtTA/+ (dark grey bars) mice at 7, 14 and 21 days post-injection (dpi). The percentage of remyelinated axons was significantly increased in TetOlig2:Sox10rtTA/+ at 7 and 14 days post-injection, compared to wild-type (P7dpi = 0.0095, P14dpi = 0.0413) or Sox10rtTA/+ mice (P7dpi < 0.001, P14dpi = 0.0343). However at 21 days post-injection, the percentage of remyelinated axons was similar in the three groups. (C) Electron micrographs illustrating remyelination of the lesions in wild-type, Sox10rtTA/+ and TetOlig2:Sox10rtTA/+ mice at 7, 14 and 21 days post-injection. Remyelinated, demyelinated and non-demyelinated axons were colour-coded in red, yellow and blue, respectively. Scale bars: A = 500 nm; C = 2 μm.
Figure 8
Figure 8
OLIG2 is mainly expressed in maturing NOGO-A+ oligodendrocytes in multiple sclerosis lesions. (A) Luxol Fast blue/MHC II staining of post-mortem multiple sclerosis brain sections, illustrating typical active, chronic active, chronic silent lesions, and remyelinated shadow plaques. (B) Immunolabellings for OLIG2 (red), PCNA and NOGO-A (both in green) were performed on the different lesion subtypes. PCNA was used to identify OPCs and NOGO-A to label differentiating oligodendrocytes. Nuclei were counterstained with DAPI. (C) Quantification of OLIG2+ cell density in the different subtypes of multiple sclerosis lesions and normal-appearing white matter (NAWM). The density of OLIG2+ cells is significantly increased in active lesions compared to chronic active and chronic lesions (P = 0.0025 and P = 0.0047, respectively). The density in chronic active lesions is also significantly reduced compared to chronic silent lesions, shadow plaques and normal-appearing white matter (P = 0.0029, P = 0.0024 and P = 0.0016, respectively) and in chronic silent lesions versus shadow plaques and normal-appearing white matter (P < 0.001 and P = 0.0019, respectively). (D) Quantifications of OLIG2+ cells expressing PCNA or NOGO-A, according to lesion activity. OLIG2+/NOGO-A+ maturing oligodendrocytes were mainly detected in active lesions with respect to shadow plaques and chronic silent lesions (P ≤ 0.05). Scale bars: A = 1 mm; B = 50 µm.

References

    1. Arnett HA, Fancy SP, Alberta JA, Zhao C, Plant SR, Kaing S, et al. bHLH transcription factor Olig1 is required to repair demyelinated lesions in the CNS. Science. 2004;306:2111–15. - PubMed
    1. Avellana-Adalid V, Nait-Oumesmar B, Lachapelle F, Baron-Van Evercooren A. Expansion of rat oligodendrocyte progenitors into proliferative “oligospheres” that retain differentiation potential. J Neurosci Res. 1996;45:558–70. - PubMed
    1. Bachelin C, Zujovic V, Buchet D, Mallet J, Baron-Van Evercooren A. Ectopic expression of polysialylated neural cell adhesion molecule in adult macaque Schwann cells promotes their migration and remyelination potential in the central nervous system. Brain. 2010;133:406–20. - PMC - PubMed
    1. Chang A, Tourtellotte WW, Rudick R, Trapp BD. Premyelinating oligodendrocytes in chronic lesions of multiple sclerosis. N Engl J Med. 2002;346:165–73. - PubMed
    1. Cui HK, Zhao B, Li Y, Guo Y, Hu H, Liu L, et al. Design of stapled alpha-helical peptides to specifically activate Wnt/beta-catenin signaling. Cell Res. 2013;23:581–4. - PMC - PubMed

Publication types

MeSH terms

Substances