. 2015 Mar;5(3):255-63.
doi: 10.1158/2159-8290.CD-14-1326. Epub 2015 Jan 6.

Lysine demethylase KDM4A associates with translation machinery and regulates protein synthesis

Affiliations

Lysine demethylase KDM4A associates with translation machinery and regulates protein synthesis

Capucine Van Rechem et al. Cancer Discov. 2015 Mar.

Abstract

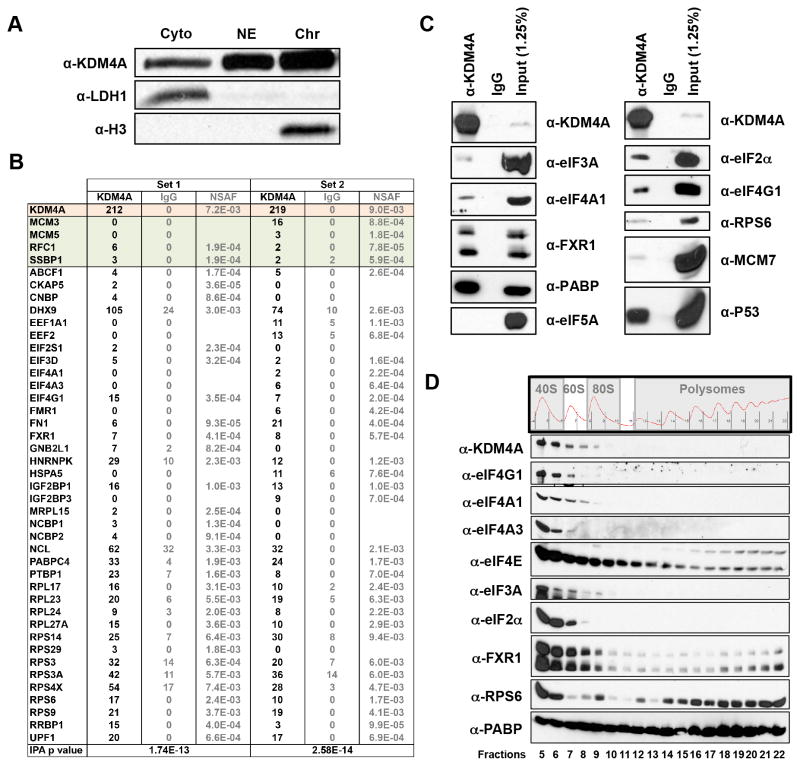
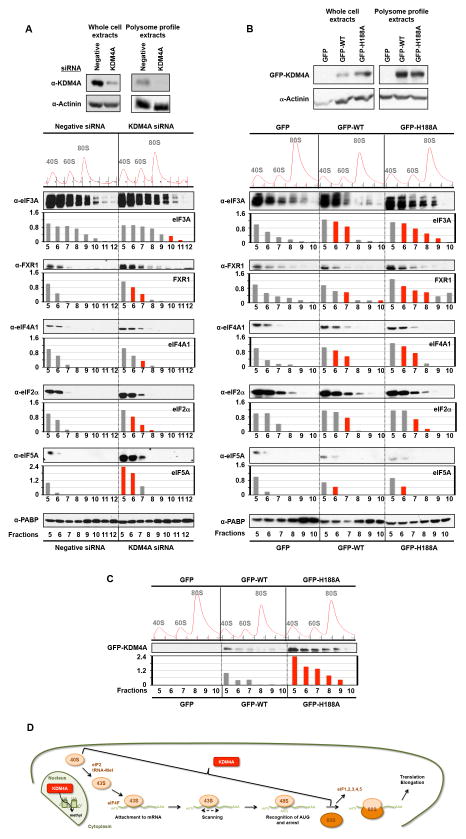
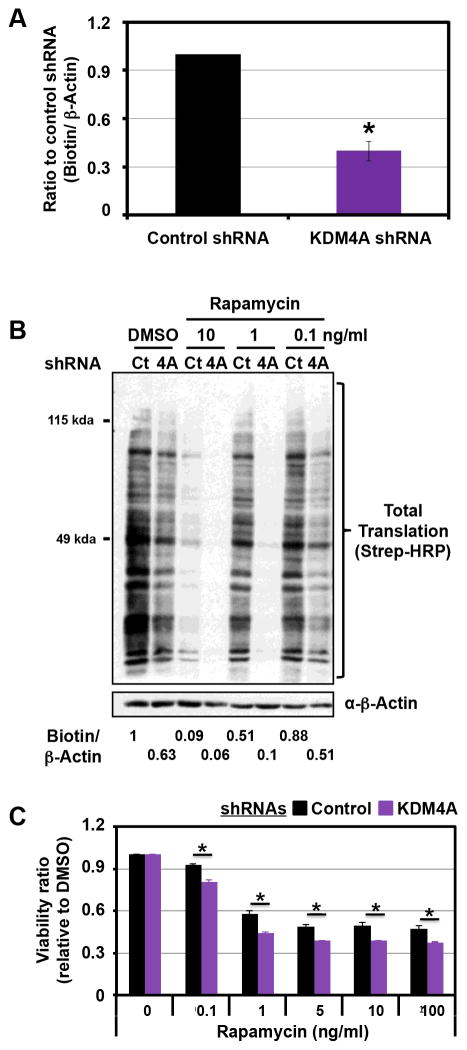
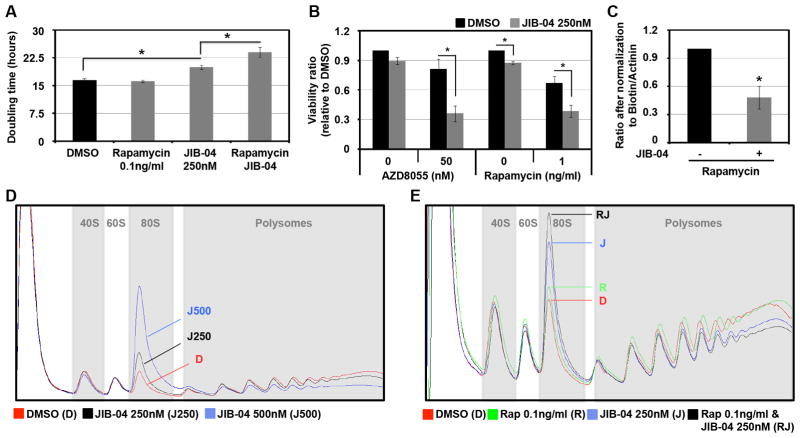
Chromatin-modifying enzymes are predominantly nuclear; however, these factors are also localized to the cytoplasm, and very little is known about their role in this compartment. In this report, we reveal a non-chromatin-linked role for the lysine-specific demethylase KDM4A. We demonstrate that KDM4A interacts with the translation initiation complex and affects the distribution of translation initiation factors within polysome fractions. Furthermore, KDM4A depletion reduced protein synthesis and enhanced the protein synthesis suppression observed with mTOR inhibitors, which paralleled an increased sensitivity to these drugs. Finally, we demonstrate that JIB-04, a JmjC demethylase inhibitor, suppresses translation initiation and enhances mTOR inhibitor sensitivity. These data highlight an unexpected cytoplasmic role for KDM4A in regulating protein synthesis and suggest novel potential therapeutic applications for this class of enzyme.

Significance: This report documents an unexpected cytoplasmic role for the lysine demethylase KDM4A. We demonstrate that KDM4A interacts with the translation initiation machinery, regulates protein synthesis and, upon coinhibition with mTOR inhibitors, enhances the translation suppression and cell sensitivity to these therapeutics.


Conflict of interest statement

Conflict of Interest: The authors declare competing financial interests because JRW is a consultant for QSonica.

Figures

Figure 1
Figure 1. KDM4A interacts with the translation initiation machinery
(A) KDM4A is present in the cytoplasm and the nucleus. RPE cells were fractionated and western blotted for KDM4A and control proteins for the fractionations. (B) KDM4A interacts with the translation initiation machinery. Endogenous KDM4A was immunoprecipitated with a rabbit polyclonal antibody from HEK 293T cells and analyzed by mass spectrometry. The upper part of the table (in color; (8)) represents the peptides and NSAF values for KDM4A and previously confirmed interactors. The bottom part of the table (in white) represents the proteins present in the IPA “translation” category. (C) KDM4A interacts with the translation initiation machinery. These interactions were confirmed by western blotting Fab immunoprecipitated KDM4A from HEK 293T cells. (D) KDM4A sediments in the 40S and 60S polysome fractions. HEK 293T lysates were separated on sucrose gradient before fractions from polysome profiles were collected and immunoblotted with the indicated antibodies.
Figure 2
Figure 2. KDM4A levels impact the distribution of translation initiation factors
(A–B) Fractions collected from the polysome profiles [Negative Control (Negative) or KDM4A depleted HEK 293T cells for 48h (panel A); HEK 293T cells overexpressing WT or H188A for 24h (panel B)] were immunoblotted with the indicated antibodies. Representative western blots are shown below the graphs and represent the average of the quantification by ImageJ from two independent experiments. The red bars represent a reproducible increase of at least 20% compared to the control fractions from independent KDM4A siRNA treated cells or KDM4A WT or H188A overexpressing cells (see individual experiments in Figure S1C,D). The upper western blot panels represent whole cell extracts or the input extracts used to generate the polysome profiles. (C) Fractions collected from the polysome profiles from HEK 293T cells overexpressing GFP, WT or H188A for 24h were immunoblotted with anti-GFP and the corresponding graph represents the average from two independent experiments. The y-axis represents the fold change for each fraction relative to the fraction 5 from the corresponding control. For (A), the Negative siRNA is the control, whereas, for (B) the GFP is the control. For panel C, the GFP-WT is the control. The red bars represent a reproducible increase of at least 20% compared to the GFP-WT fractions between two independent experiments. (D) Schematic representing where KDM4A could directly be involved in translation. Also see supplementary Figure S1.
Figure 3
Figure 3. KDM4A depletion reduces protein synthesis and enhances mTOR inhibitor sensitivity
(A) HEK 293T cells transfected with KDM4A shRNA present a decrease in overall translation. Forty eight hours after transfection, cells were deprived of cysteine and methionine for 1h and grown in the presence of the nucleotide analog AHA (L-Azidohomoalanine) for 2h. The newly synthesized proteins were labeled with biotin and equal amounts of total protein were immunoblotted with streptavidin-HRP. The graph represents an average of five independent experiments performed with two different KDM4A shRNA. The Y axis represents the ratio of total biotinylated proteins upon KDM4A shRNA to total biotinylated proteins upon control shRNA, which were normalized to β-actin. (B) KDM4A knock-down enhanced the decrease in translation obtained after Rapamycin treatment. Forty eight hours after transfection, HEK 293T cells were treated with the indicated concentration of Rapamycin for 24h and then treated as in (A). The ratio of biotin/β-actin has been calculated with ImageJ and represents the average of two independent experiments. (C) HEK 293T cells depleted for KDM4A are more sensitive to Rapamycin than cells transfected with the control vector. Cells were seeded 24h after the second shRNA transfection and were then treated with the indicated concentrations and associated concentrations 24h later. Forty-eight hours after treatment, samples were analyzed by MTT assay. The assays were normalized to a sample collected and assayed at the treatment time. The Y axis represents the viability ratio relative to DMSO. The average of three independent experiments is represented. All error bars represent the SEM. p values were determined by a two-tailed student’s t test; * represents p<0.05. Also see supplementary Figure S2.
Figure 4
Figure 4. JIB-04 inhibits translation initiation
(A–B) HEK 293T cells treated with JIB-04 are more sensitive to mTOR inhibitors than cells treated with vehicle. (A) HEK 293T cells were treated with 250nM of JIB-04 and/or 100ng/ml of Rapamycin 24h after seeding. The Y axis represents the doubling time between 5h and 35h after Rapamycin treatment. The average of three independent experiments is represented. (B) HEK 293T cells were treated with the indicated drugs 24h after seeding, and 48h later they analyzed by MTT assay. The Y axis represents the viability ratio relative to DMSO. The average of three independent experiments is represented. (C) JIB-04 enhanced the decrease in translation obtained after Rapamycin treatment. HEK 293T cells were treated with 250nM of JIB-04 and/or 0.1ng/ml of Rapamycin for 24h and then treated as in Figure 3A. The graph represents an average of three independent experiments. The Y axis represents the ratio after normalization to total biotinylated proteins to Actinin. (D) JIB-04 treated cells have a translation initiation defect. HEK 293T cells treated with the indicated concentration of JIB-04 for 24h before being analyzed by polysome profiling. (E) JIB-04 enhanced the translation initiation defect obtained after Rapamycin treatment. HEK 293T cells treated with the 250nM of JIB-04 and/or 0.1ng/ml of Rapamycin for 24h were analyzed by polysome profiling. All error bars represent the SEM. p values were determined by a two-tailed student’s t test; * represents p<0.05. Also see supplementary Figure S3.

Comment in

References

    1. Mazur PK, Reynoird N, Khatri P, Jansen PW, Wilkinson AW, Liu S, et al. SMYD3 links lysine methylation of MAP3K2 to Ras-driven cancer. Nature. 2014;510:283–7. - PMC - PubMed
    1. Su IH, Dobenecker MW, Dickinson E, Oser M, Basavaraj A, Marqueron R, et al. Polycomb group protein ezh2 controls actin polymerization and cell signaling. Cell. 2005;121:425–36. - PubMed
    1. Donlin LT, Andresen C, Just S, Rudensky E, Pappas CT, Kruger M, et al. Smyd2 controls cytoplasmic lysine methylation of Hsp90 and myofilament organization. Genes & development. 2012;26:114–9. - PMC - PubMed
    1. Van Rechem C, Whetstine JR. Examining the impact of gene variants on histone lysine methylation. Biochimica et biophysica acta. 2014;1839:1463–76. - PMC - PubMed
    1. Greer EL, Shi Y. Histone methylation: a dynamic mark in health, disease and inheritance. Nat Rev Genet. 2012;13:343–57. - PMC - PubMed

Publication types

MeSH terms