

A coding single-nucleotide polymorphism in lysine demethylase KDM4A associates with increased sensitivity to mTOR inhibitors
- PMID: 25564517
- PMCID: PMC4355226
- DOI: 10.1158/2159-8290.CD-14-1159
A coding single-nucleotide polymorphism in lysine demethylase KDM4A associates with increased sensitivity to mTOR inhibitors
Abstract
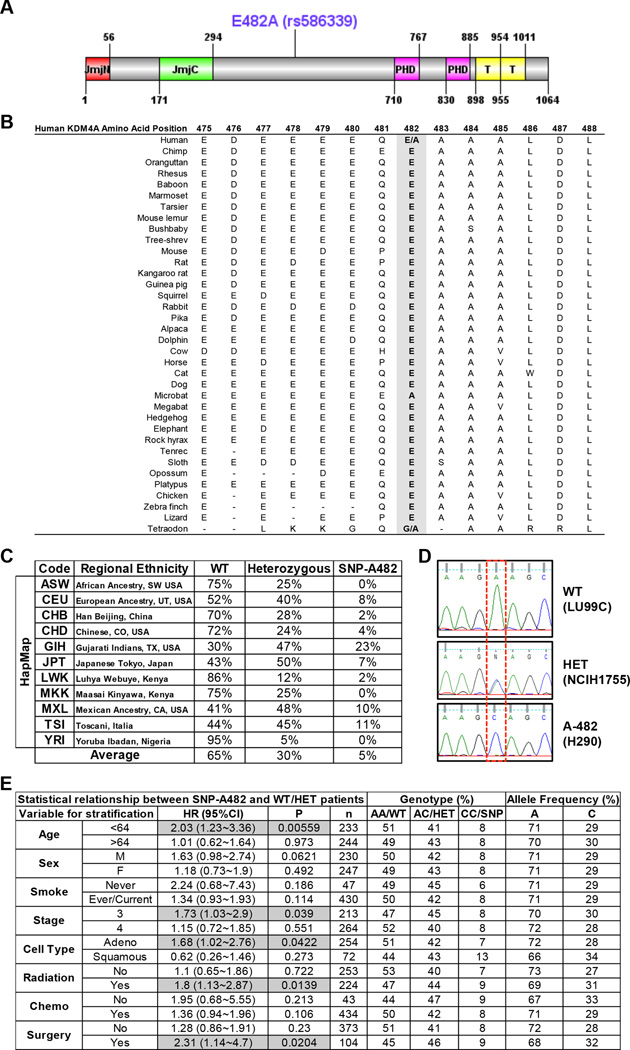
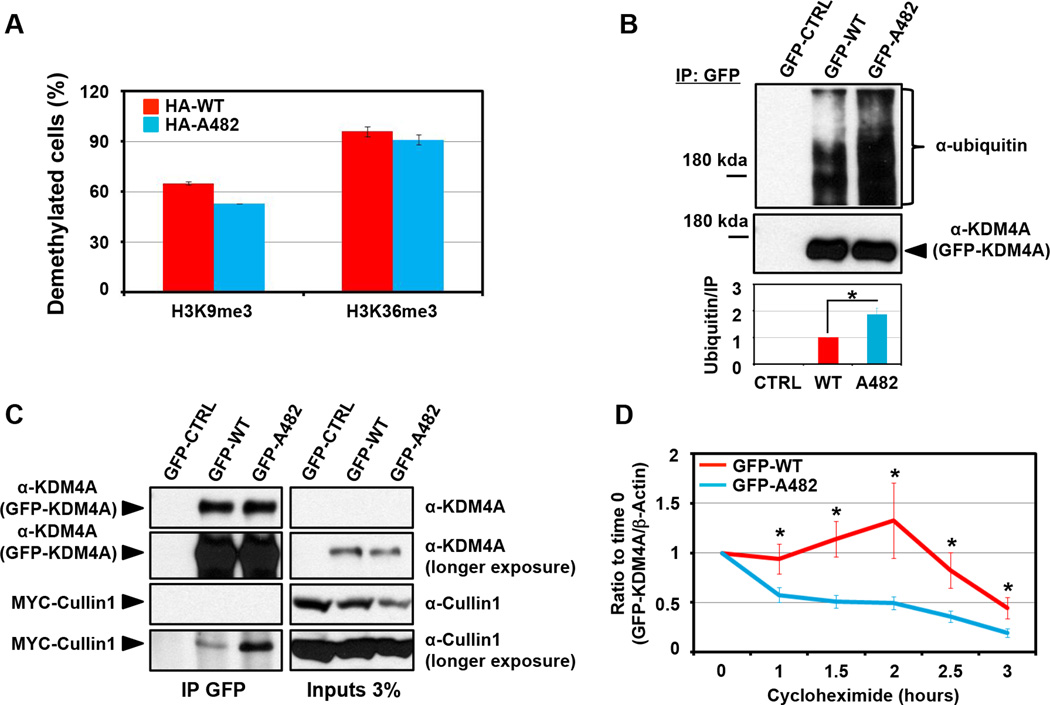
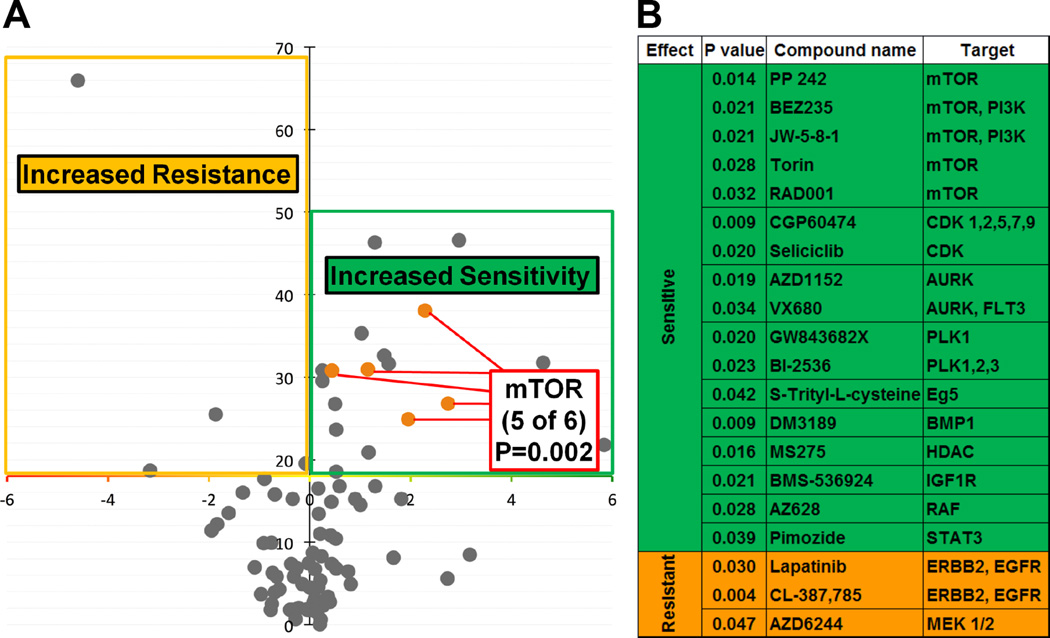
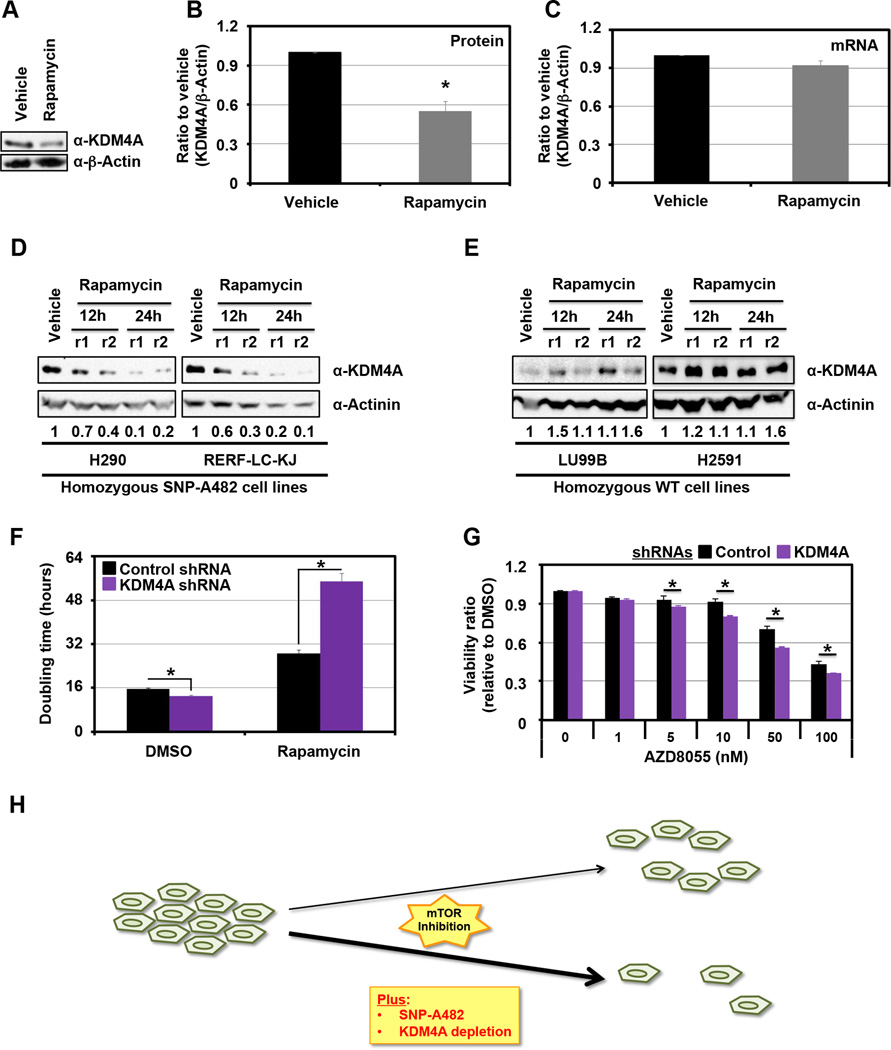
SNPs occur within chromatin-modulating factors; however, little is known about how these variants within the coding sequence affect cancer progression or treatment. Therefore, there is a need to establish their biochemical and/or molecular contribution, their use in subclassifying patients, and their impact on therapeutic response. In this report, we demonstrate that coding SNP-A482 within the lysine tridemethylase gene KDM4A/JMJD2A has different allelic frequencies across ethnic populations, associates with differential outcome in patients with non-small cell lung cancer (NSCLC), and promotes KDM4A protein turnover. Using an unbiased drug screen against 87 preclinical and clinical compounds, we demonstrate that homozygous SNP-A482 cells have increased mTOR inhibitor sensitivity. mTOR inhibitors significantly reduce SNP-A482 protein levels, which parallels the increased drug sensitivity observed with KDM4A depletion. Our data emphasize the importance of using variant status as candidate biomarkers and highlight the importance of studying SNPs in chromatin modifiers to achieve better targeted therapy.
Significance: This report documents the first coding SNP within a lysine demethylase that associates with worse outcome in patients with NSCLC. We demonstrate that this coding SNP alters the protein turnover and associates with increased mTOR inhibitor sensitivity, which identifies a candidate biomarker for mTOR inhibitor therapy and a therapeutic target for combination therapy.
©2015 American Association for Cancer Research.
Conflict of interest statement
Conflicts of interest1
1 The authors declare competing financial interests: JRW is a consultant for QSonica.
Figures
Comment in
-
From histones to ribosomes: a chromatin regulator tangoes with translation.Cancer Discov. 2015 Mar;5(3):228-30. doi: 10.1158/2159-8290.CD-15-0073. Cancer Discov. 2015. PMID: 25749972 Free PMC article.
Similar articles
-
From histones to ribosomes: a chromatin regulator tangoes with translation.Cancer Discov. 2015 Mar;5(3):228-30. doi: 10.1158/2159-8290.CD-15-0073. Cancer Discov. 2015. PMID: 25749972 Free PMC article.
-
Lysine demethylase KDM4A associates with translation machinery and regulates protein synthesis.Cancer Discov. 2015 Mar;5(3):255-63. doi: 10.1158/2159-8290.CD-14-1326. Epub 2015 Jan 6. Cancer Discov. 2015. PMID: 25564516 Free PMC article.
-
Influence of the KDM4A rs586339 polymorphism on overall survival in Asian non-small-cell lung cancer patients.Pharmacogenet Genomics. 2017 Mar;27(3):120-123. doi: 10.1097/FPC.0000000000000266. Pharmacogenet Genomics. 2017. PMID: 28059867
-
The role of the histone demethylase KDM4A in cancer.Cancer Genet. 2015 May;208(5):215-24. doi: 10.1016/j.cancergen.2014.11.001. Epub 2014 Nov 20. Cancer Genet. 2015. PMID: 25633974 Review.
-
KDM4 histone demethylase inhibitors for anti-cancer agents: a patent review.Expert Opin Ther Pat. 2015 Feb;25(2):135-44. doi: 10.1517/13543776.2014.991310. Epub 2014 Dec 3. Expert Opin Ther Pat. 2015. PMID: 25468267 Review.
Cited by
-
Overexpression of KDM4D promotes acute myeloid leukemia cell development by activating MCL-1.Am J Transl Res. 2021 Apr 15;13(4):2308-2319. eCollection 2021. Am J Transl Res. 2021. PMID: 34017391 Free PMC article.
-
Epigenetic modulators provide a path to understanding disease and therapeutic opportunity.Genes Dev. 2024 Jul 19;38(11-12):473-503. doi: 10.1101/gad.351444.123. Genes Dev. 2024. PMID: 38914477 Free PMC article. Review.
-
Genome-wide association study identifies variation at 6q25.1 associated with survival in multiple myeloma.Nat Commun. 2016 Jan 8;7:10290. doi: 10.1038/ncomms10290. Nat Commun. 2016. PMID: 26743840 Free PMC article.
-
Epigenetic modifications in KDM lysine demethylases associate with survival of early-stage NSCLC.Clin Epigenetics. 2018 Apr 2;10:41. doi: 10.1186/s13148-018-0474-3. eCollection 2018. Clin Epigenetics. 2018. PMID: 29619118 Free PMC article.
-
KDM4/JMJD2 Histone Demethylase Inhibitors Block Prostate Tumor Growth by Suppressing the Expression of AR and BMYB-Regulated Genes.Chem Biol. 2015 Sep 17;22(9):1185-96. doi: 10.1016/j.chembiol.2015.08.007. Epub 2015 Sep 10. Chem Biol. 2015. PMID: 26364928 Free PMC article.
References
Publication types
MeSH terms
Substances
Grants and funding
LinkOut - more resources
Full Text Sources
Molecular Biology Databases
Miscellaneous
