. 2015 Jan;43(2):1241-56.
doi: 10.1093/nar/gku1352. Epub 2015 Jan 6.

Escherichia coli antitoxin MazE as transcription factor: insights into MazE-DNA binding

Affiliations

Escherichia coli antitoxin MazE as transcription factor: insights into MazE-DNA binding

Valentina Zorzini et al. Nucleic Acids Res. 2015 Jan.

Abstract

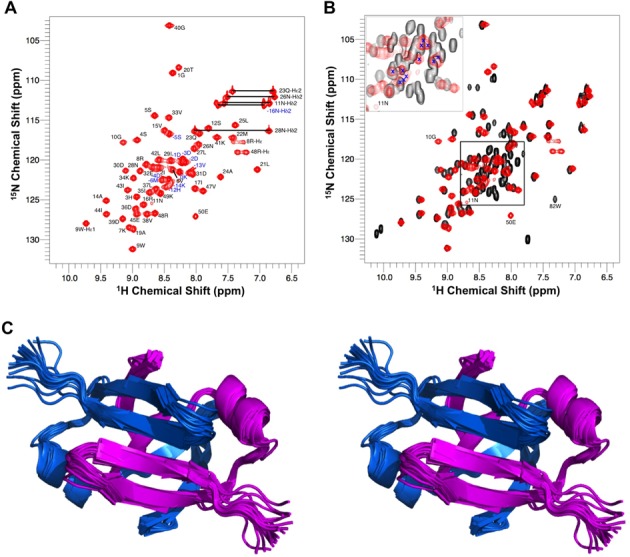
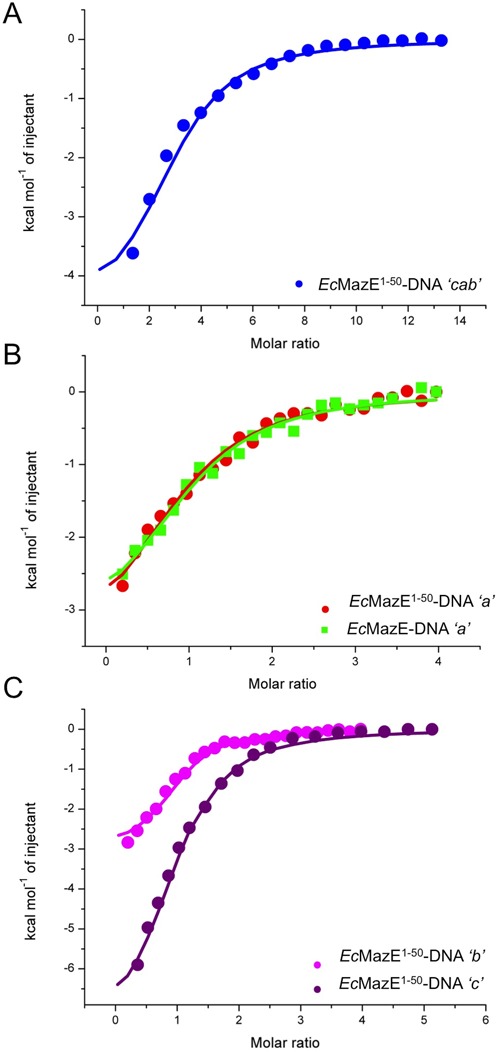
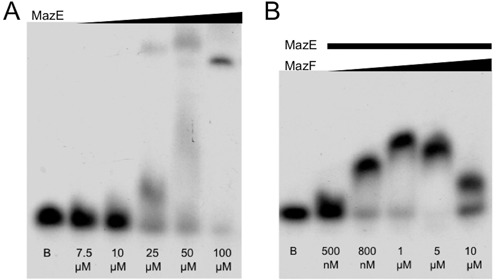
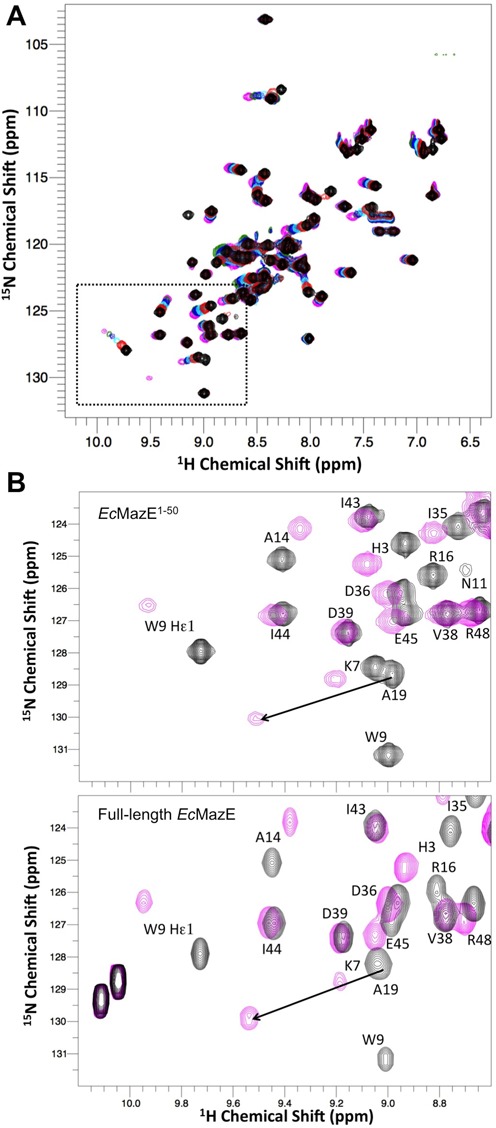
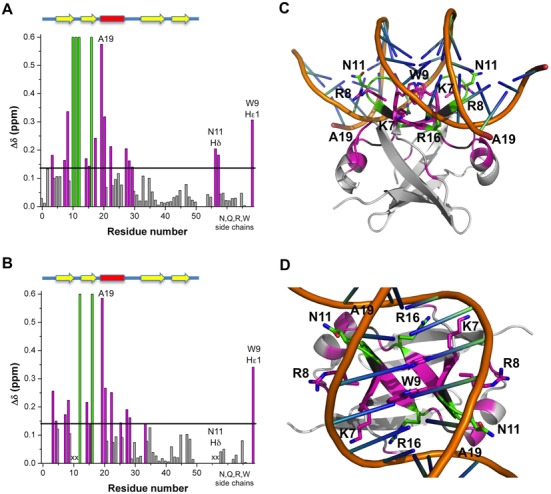
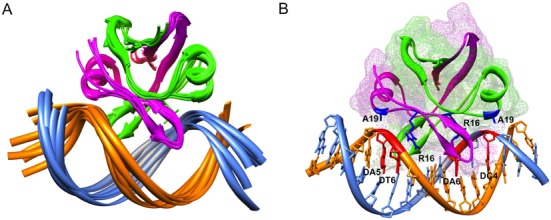
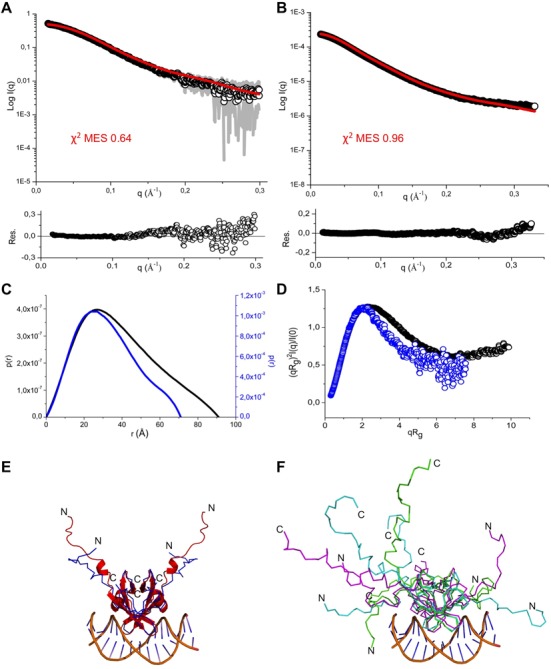
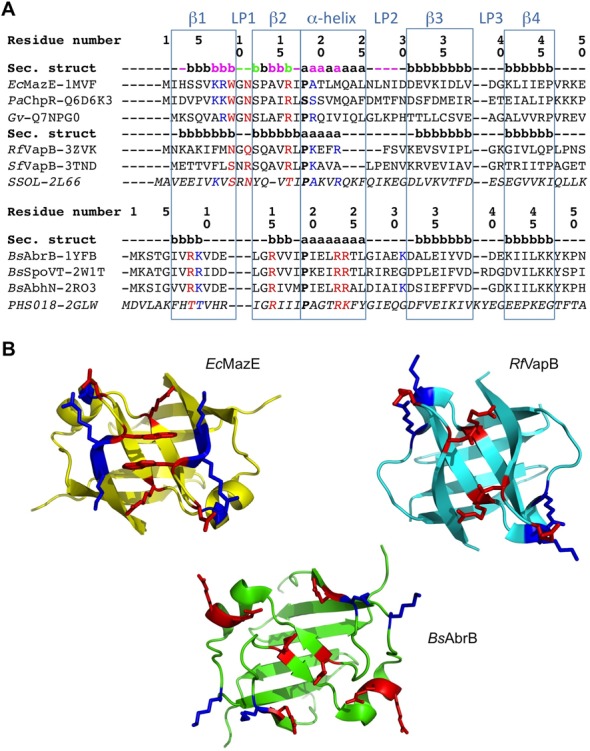
Toxin-antitoxin (TA) modules are pairs of genes essential for bacterial regulation upon environmental stresses. The mazEF module encodes the MazF toxin and its cognate MazE antitoxin. The highly dynamic MazE possesses an N-terminal DNA binding domain through which it can negatively regulate its own promoter. Despite being one of the first TA systems studied, transcriptional regulation of Escherichia coli mazEF remains poorly understood. This paper presents the solution structure of C-terminal truncated E. coli MazE and a MazE-DNA model with a DNA palindrome sequence ∼ 10 bp upstream of the mazEF promoter. The work has led to a transcription regulator-DNA model, which has remained elusive thus far in the E. coli toxin-antitoxin family. Multiple complementary techniques including NMR, SAXS and ITC show that the long intrinsically disordered C-termini in MazE, required for MazF neutralization, does not affect the interactions between the antitoxin and its operator. Rather, the MazE C-terminus plays an important role in the MazF binding, which was found to increase the MazE affinity for the palindromic single site operator.


Figures

Figure 1.
Figure 1.
NMR characterization of EcMazE1–50 versus full-length EcMazE. (A) Assigned 600 MHz 1H-15N-HSQC spectrum of 13C-15N-labeled EcMazE1–50 at 298K. EcMazE1–50 peaks of backbone 1H, 15N pairs are numbered with their corresponding position in the amino-acid sequence. Peaks labeled in blue belong to the EcMazE1–50 His-tag. (B) In red the 600 MHz 1H-15N-HSQC spectrum of EcMazE1–50 and in black the 600 MHz 1H-15N-HSQC spectrum of full-length EcMazE. The inset contains peaks of the N-terminal His-tag and all peaks of the C-terminus of full-length EcMazE (aa 50–81), except C-terminal Trp82. The same region contains the peaks of the EcMazE1–50 His-tag, indicated with a blue X. Peaks belonging to G10 and N11 visible in the EcMazE1–50 HSQC and not detectable in the full-length EcMazE HSQC are indicated. (C) Stereo cartoon representation of the 20 lowest energy EcMazE1–50 NMR structures; the two monomers are colored in sky-blue and magenta. The highly flexible N-terminal (His-tag) was removed from the NMR ensemble for clarity. Figure created in PyMol.
Figure 2.
Figure 2.
Isothermal titration calorimetry on EcMazE-DNA binding. (A) ITC titration curve for EcMazE1–50 binding to DNA ‘cab’ at 305 K. (B) ITC titration curves for EcMazE1–50 and full-length EcMazE binding to DNA ‘a’ at 305 K in red (circles) and in green (squares), respectively. (C) ITC titration curve for EcMazE1–50-DNA ‘c’ in purple and EcMazE1–50-DNA ‘b’ in magenta measured at 305 K. The solid lines in panels (A), (B) and (C) correspond to the best fit using a n equal to 1 binding site model. The thermodynamic parameters for the EcMazE-DNA binding are reported in Table 2.
Figure 3.
Figure 3.
EcMazEF toxin–antitoxin system shows higher affinity binding than the antitoxin alone for its single site operator fragment. (A) Concentration-dependent binding of full-length EcMazE to the single site ‘a’ operator fragment. As the EcMazE concentration increases the DNA shifts from the free state to a EcMazE–DNA complex. Blank sample (DNA without protein) is indicated by a B. (B) Binding of EcMazE to the single site ‘a’ operator fragment enhanced by MazF. All samples include equal concentration of antitoxin EcMazE (1 μM), which is not sufficient to cause a shift of the DNA band. As the EcMazF concentration increases and approaches the 1:1 ratio with the antitoxin, however, a clear mobility shift is observed. At higher ratios, the shift disappears again. B: blank sample (DNA without protein).
Figure 4.
Figure 4.
Binding of DNA ‘a’ to EcMazE monitored by NMR. (A) 1H-15N-HSQC spectra recorded during titrations of EcMazE1–50 with DNA ‘a’. All spectra are plotted at the same contour level and are colored from black (free form) to magenta (last titration point). (B) Selected region of 1H-15N-HSQC spectra recorded during titrations of EcMazE1–50 with DNA ‘a’. Only NMR spectra of the EcMazE1–50 free form (black) and of the last titration point (magenta) are shown. For clarification, the black arrow indicates the direction of the chemical shift changes for Ala 19. (C) The same selected region of the 1H-15N-HSQC spectra of free full-length EcMazE (black) and in complex with DNA ‘a’ (magenta).
Figure 5.
Figure 5.
Chemical shift mapping of the DNA ‘a’ binding sites on EcMazE1–50 and full-length EcMazE. (A) Residue-specific DNA ‘a’-induced chemical shift changes EcMazE1–50. The chemical shift perturbations Δδ < Δδav + formula image SD are colored gray, Δδ > Δδav + formula image SD colored magenta, in green the residues of which their peak disappear upon addition of the DNA. The black line represents the chemical shift perturbations Δδav + formula image SD. Secondary structure elements within the EcMazE1–50 structure are indicated by yellow arrows (β-strands) and red bars (α-helices). (B) Residue-specific DNA ‘a’-induced chemical shift changes full-length EcMazE. Color coding as in (A). Residues not visible in the HSQC spectra of free full-length EcMazE are labeled as x. (C, D) Chemical shift mapping on the representative free NMR structure of EcMazE1–50 superimposed on VapB within the VapBC2–DNA complex (showing only the DNA within the complex, PDB entry 3ZVK) as in Supplementary Figure S6. Color coding as in (A). Figures prepared using PyMol.
Figure 6.
Figure 6.
Structural model of the EcMazE1–50–DNA ‘a’ complex. (A) Cartoon representation of the ensemble of the seven HADDOCK structures with the lowest interaction energies and lowest AIR violations. The two EcMazE1–50 monomers are colored green and magenta, the two DNA strands in orange and sky-blue. (B) Details of the EcMazE1–50–DNA complex showing the lowest-interaction energy structure of the ensemble. Color coding as in (A). The EcMazE1–50 dimer is also shown in mesh surface. Residues and nucleotides involved in H-bonding common in the ensemble are shown in blue (EcMazE1–50) and red (DNA) sticks, respectively. Figures prepared using Chimera.
Figure 7.
Figure 7.
Small angle X-ray scattering of EcMazE-DNA ‘a’. (A, B) The experimental SAXS curve for EcMazE1–50–DNA ‘a’ and full-length EcMazE–DNA ‘a’ complexes are shown in open dots, while the error margins are shown in gray. The fit of the minimal search ensemble (MES) of two structures for EcMazE1–50-DNA ‘a’ is reported in red (A), while for full-length EcMazE-DNA ‘a’, the fit of the MES is with three structures (red line in (B)). The residual fitting is reported below for both systems. (C) Overlay of two p(r) function of EcMazE1–50-DNA ‘a’ (blue) and full-length EcMazE-DNA ‘a’ (black). (D) Overlay of two normalized Kratky plots corresponding to the EcMazE1–50-DNA ‘a’ (blue) and full-length EcMazE-DNA ‘a’ (black) shown as open dots. (E, F) A cartoon representation of the minimal set of two NMR structures of the EcMazE1–50–DNA ‘a’ complex and three structures of the full-length EcMazE–DNA ‘a’ complex. The N-terminal His-tag and the extended flexible C-terminal tails are indicated by N and C. Panels (E) and (F) were created using PyMol.
Figure 8.
Figure 8.
Structure-based sequence alignment of AbrB-like domain superfamily members. (A) Sequence alignment of the superfamily divided into two main families; the first one contains two subgroups. The consensus secondary structure within the superfamily is highlighted in light blue squares. Secondary structure elements within each family and sub-group are also given, representing the first one in each. The one belonging to EcMazE is color-coded by the CSP given in Figure 5 (Δδ > Δδav + formula image SD colored magenta, in green the residues of which their peaks disappear upon addition of the DNA). Residue numbering for the two families corresponds to that of EcMazE and BsAbrB, respectively. Key residues for DNA interaction are colored red, additional residues stabilizing the protein–DNA interaction in blue. The sequences from top to bottom are (corresponding PDB or Uniprot entries are given between parenthesis): EcMazE: Escherichia coli MazE antitoxin (1MVF); PaChpR: Pectobacterium atrosepticum ChpR suppressor of growth inhibitor (Q6D6K3); Gv: Gloeobacter violaceus cell growth regulatory protein (Q7NPG0); RfVapB: Rickettsia felis VapB antitoxin (3ZVK); SfVapB: Shigella flexneri VapB antitoxin (3TND); SSOL: Sulfolobus solfataricus transcription regulator (2L66); BsAbrB: Bacillus subtilis AbrB transition state regulator (1YFB); BsSpoVT: Bacillus subtilis SpoVT stage V sporulation protein T (2W1T); BsAbhN: Bacillus subtilis AbhN putative transition state regulator (2RO3); PHS018: Pyrococcus horikoshii S018 putative uncharacterized protein (2GLW). (B) Representative structures of the two AbrB-like domain families. Structures were superimposed using Pymol and thus are in the same orientation. Residues important for DNA binding are given in sticks and colored as defined in (A).

Similar articles

Cited by

References

    1. Bravo A., de Torrontegui G., Díaz R. Identification of components of a new stability system of plasmid R1, ParD, that is close to the origin of replication of this plasmid. Mol. Gen. Genet. 1987;210:101–110. - PubMed
    1. Brown J.M., Shaw K.J. A novel family of Escherichia coli toxin-antitoxin gene pairs. J. Bacteriol. 2003;185:6600–6608. - PMC - PubMed
    1. Pandey D.P., Gerdes K. Toxin–antitoxin loci are highly abundant in free-living but lost from host-associated prokaryotes. Nucleic Acids Res. 2005;33:966–976. - PMC - PubMed
    1. Gerdes K., Wagner E.G.H. RNA antitoxins. Curr. Opin. Microbiol. 2007;10:117–124. - PubMed
    1. Buts L., Lah J., Dao-Thi M., Wyns L., Loris R. Toxin-antitoxin modules as bacterial metabolic stress managers. Trends Biochem. Sci. 2005;30:672–679. - PubMed

Publication types

MeSH terms