. 2015 Jan;43(2):1304-16.
doi: 10.1093/nar/gku1366. Epub 2015 Jan 6.

Global coordination in adaptation to gene rewiring

Affiliations

Global coordination in adaptation to gene rewiring

Yoshie Murakami et al. Nucleic Acids Res. 2015 Jan.

Abstract

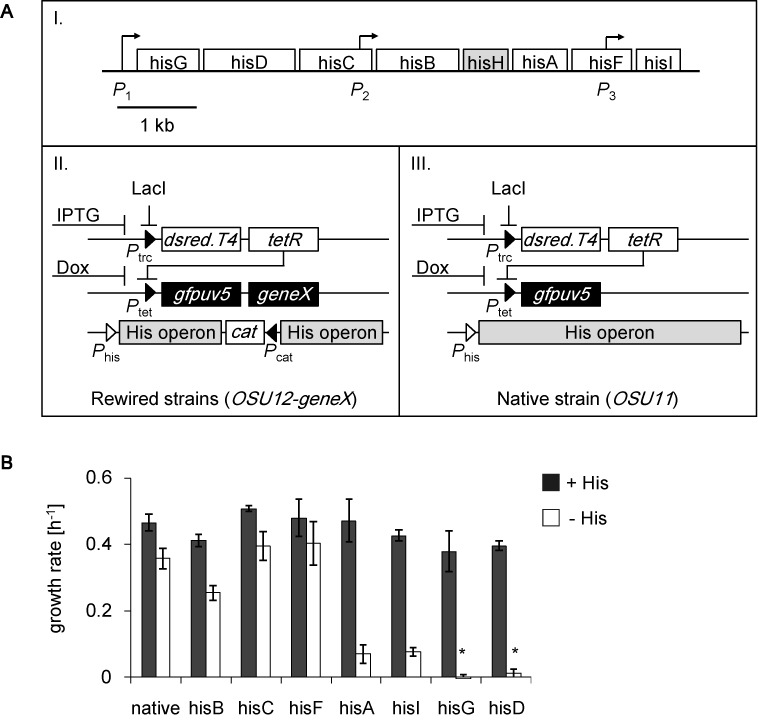
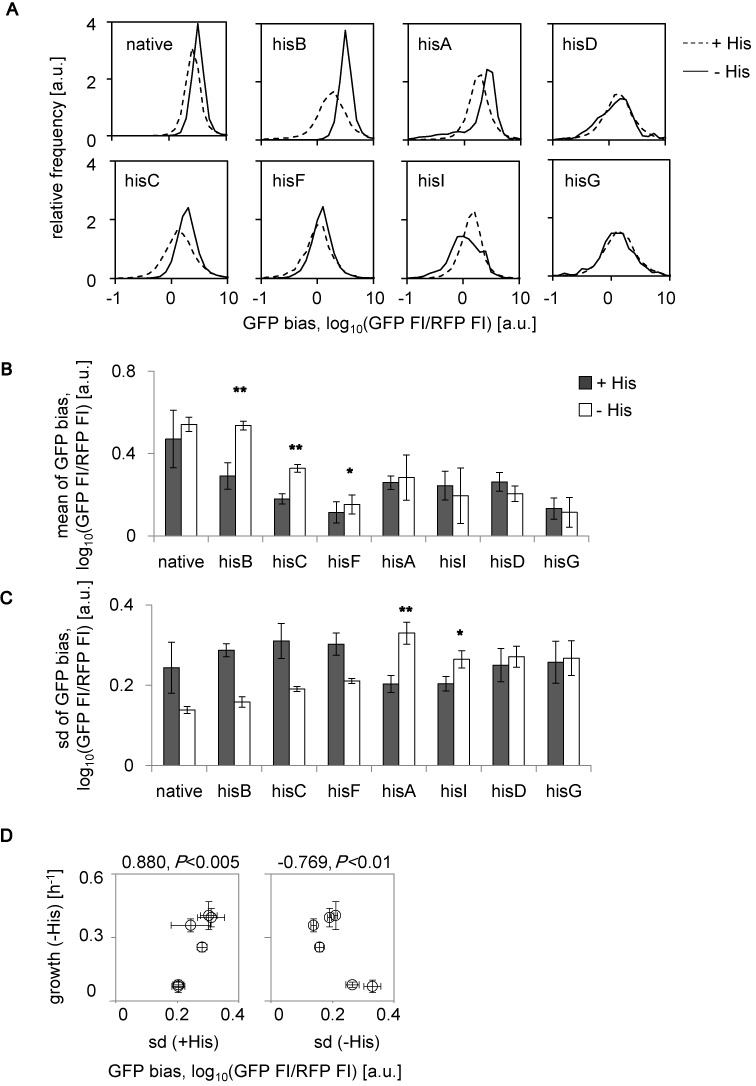
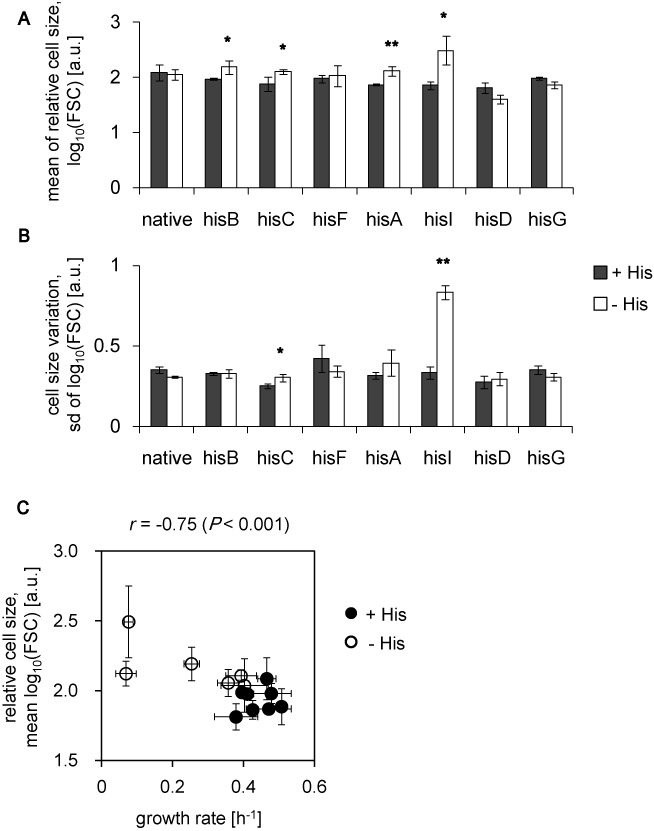
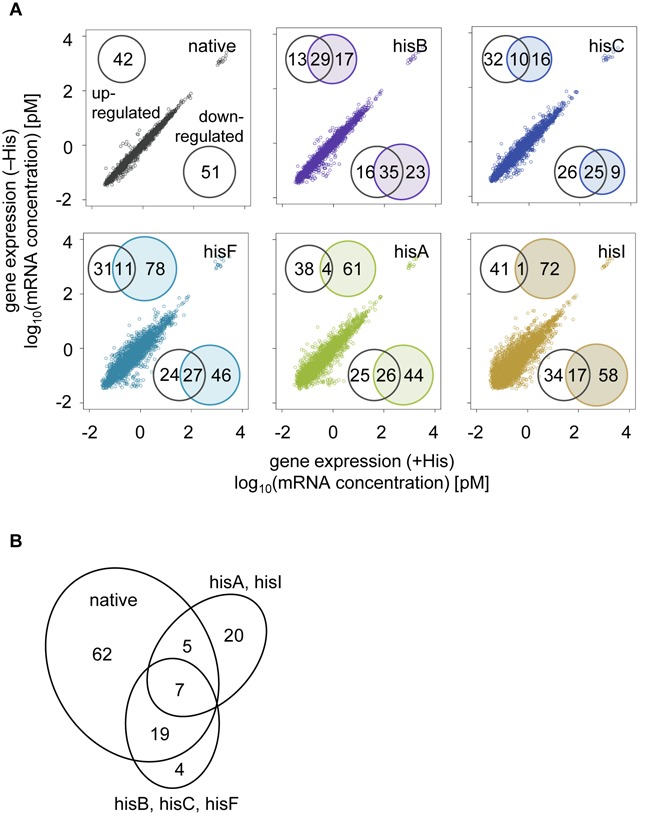
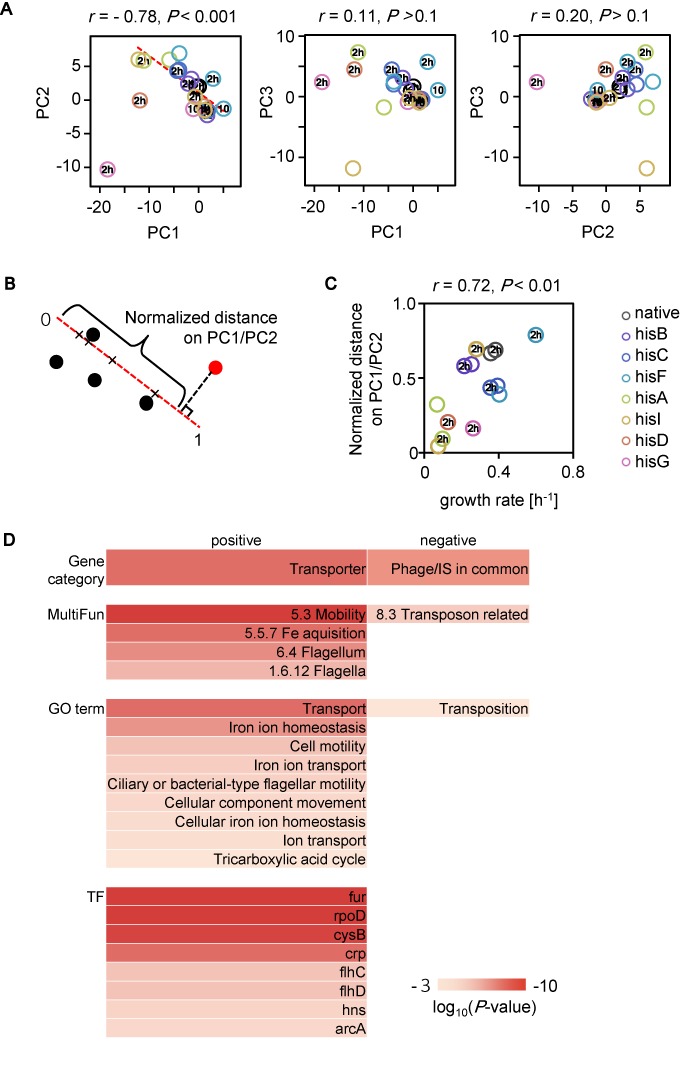
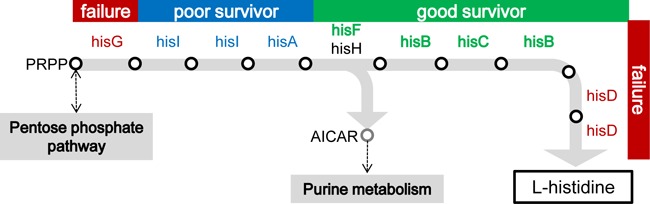
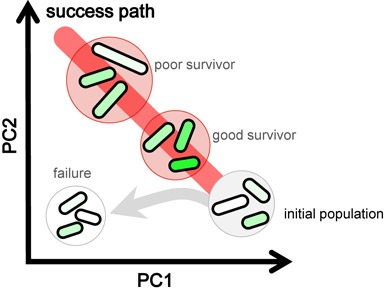
Gene rewiring is a common evolutionary phenomenon in nature that may lead to extinction for living organisms. Recent studies on synthetic biology demonstrate that cells can survive genetic rewiring. This survival (adaptation) is often linked to the stochastic expression of rewired genes with random transcriptional changes. However, the probability of adaptation and the underlying common principles are not clear. We performed a systematic survey of an assortment of gene-rewired Escherichia coli strains to address these questions. Three different cell fates, designated good survivors, poor survivors and failures, were observed when the strains starved. Large fluctuations in the expression of the rewired gene were commonly observed with increasing cell size, but these changes were insufficient for adaptation. Cooperative reorganizations in the corresponding operon and genome-wide gene expression largely contributed to the final success. Transcriptome reorganizations that generally showed high-dimensional dynamic changes were restricted within a one-dimensional trajectory for adaptation to gene rewiring, indicating a general path directed toward cellular plasticity for a successful cell fate. This finding of global coordination supports a mechanism of stochastic adaptation and provides novel insights into the design and application of complex genetic or metabolic networks.


Figures

Figure 1.
Figure 1.
Cell fates of gene rewiring. (A) Schematic diagram of the rewired strains. Boxes I, II and III represent the structural genes of the His operon, and the genetic structures of rewired strains and the native strain, respectively. Except for hisH (gray, which function with hisF), all other structural genes were subjected to reconstruction. Both the native strain (OSU11) and the rewired strains (OSU12-geneX) carried the monostable synthetic gene circuit including the rfp (dsred.T4) and gfp (gfpuv5) reporter genes. OSU11 retains the native His operon at its native chromosomal locus. Members of the OSU12-geneX series each have a deficient His operon and a single rewired structural gene (hisG, hisD, hisC, hisB, hisA, hisF and hisI). (B) Growth fitness in the presence and absence of histidine. Exponential growth rates were evaluated in both histidine-rich (+His, filled) and histidine-free (−His, open) media. Asterisks indicate that significant cell growth was undetected within 2 days.
Figure 2.
Figure 2.
Expression of rewired genes as GFP bias. (A) Distributions of GFP bias in the presence and absence of histidine. Steady distributions of the relative cellular GFP bias in the presence (dashed lines) or absence (solid lines) of histidine are shown. The strains are indicated by the names of the rewired genes. (B) Average protein abundance. The mean values of the GFP bias in the presence (filled) and absence (open) of histidine are shown. Asterisks indicate significant increases (*P < 0.05 and **P < 0.005). C. Cell-to-cell variation in GFP bias. The standard deviation of the GFP bias in the presence (filled) and absence (open) of histidine are shown. Asterisks indicate significant increase as described in (B). (D) The relationship between growth and variation. The growth rates (Figure 1B, open) are plotted against the standard deviations (shown in C) for the data from the native, hisB, hisC, hisF, hisA and hisI strains. The strains are indicated by the names of the rewired genes. All data sets are on a logarithmic scale. The standard errors of every four independent tests are indicated.
Figure 3.
Figure 3.
Relative cell size. (A) Average cell size. The mean values of the relative cell size, which is represented by the FSC value, in the presence (filled) and absence (open) of histidine are shown. (B) Variation in cell size. The standard deviation of the FSC values in the presence (filled) and absence (open) of histidine are shown. The standard errors of every four independent tests are indicated. Asterisks indicate significant increases (*P < 0.05 and **P < 0.001). (C) The relationship between cell size and growth in the presence and absence of histidine. Growth rates (Figure 1B) are plotted against mean cell sizes, FCM (Figure 3A). Cells growing in the presence and absence of histidine are indicated as filled and open circles, respectively. The correlation coefficients and corresponding p values are indicated. Standard errors are indicated as error bars.
Figure 4.
Figure 4.
Genome-wide expression. (A) Dot plots of gene expression in the presence and absence of histidine. The numbers of differentially expressed genes (DEGs, FDR < 0.05), which are either up- or downregulated, are indicated (inlet). Venn diagrams represent the number of DEGs in the rewired strains that overlap with the native strain. (B) The number of overlapping differentially expressed genes. The DEGs that overlap among the strains are shown.
Figure 5.
Figure 5.
Expression patterns of His operon. (A) Schematic drawing of sampling points. Open circles indicate the time points of measurements and the samples collected for microarray, +His, −His (10 min), −His (2 h) and –His (>10 h). B. The expression levels of the structural genes of the His operon. The expression levels initially (+His, gray) and at 10 min (black), 2 h (blue), and >10 h (open) after histidine depletion transfer are shown. Asterisks indicate the rewired genes under foreign control that were isolated from the His operon. Standard errors of three biological replicates are indicated.
Figure 6.
Figure 6.
PCA analysis. (A) Correlations between each two PCs in PC1, PC2 and PC3 with corresponding P values are shown. Transcriptional patterns are described by principal component analysis. The principal component scores PC1, PC2 and PC3 represent 37, 17 and 15% of the total variance, respectively. The ‘10’ circles, ‘2 h’ and open circles represent the states of 10 min, 2 h and >10 h after histidine depletion, respectively. Color variations representing the different strains are indicated. (B) Schematic drawing of the calculation of normalized distance. For example, the distance of a certain condition (red filled circle) on the PC1/PC2 correlation line is shown as a basket. (C) The relationship between growth and the distance on PC1/PC2. The correlation coefficient and the P value are indicated. (D) Enriched gene function and regulation. The top 5% of genes positively and negatively (169 genes each) loading on the PC1/PC2 correlation line were used for the enrichment analysis. Gene functions are designated using gene category, MultiFun, and GO terms. Gene regulations are based on transcriptional networks, which are indicated by the names of the transcription factors (TF). Color bars indicate the significance as log-scaled P values obtained using binomial tests with Bonferroni corrections (P < 0.001).
Figure 7.
Figure 7.
Histidine biosynthetic pathway. A flow chart for histidine biosynthesis was simply constructed according to the KEGG database (61,62). The genes that were subjected to rewiring are highlighted in color. Three types of cell fates are categorized; green (good survivors), blue (poor survivors) and red (failures). The empty circles and shaded arrows represent the intermediate chemicals (metabolic products) and the corresponding enzymatic reactions (metabolic flux), respectively. Except for PRPP (5-phosphoribosyl 1-diphosphate) and AICAR (aminoimidazole carboxamide ribonucleotide), the names of the intermediate chemicals are omitted.
Figure 8.
Figure 8.
Schematic drawing of coordinated reorganization for adaptation to gene rewiring. A perspective model of cell fate decision is illustrated. Cells are drawn in rod shapes. Fluctuated expression of the rewired gene is represented with the gradations in green, light to dark green, which represents low to high expression. Changes in cell size are indicated as the varied length of the rod shaped drawings. The rewired strain is shown as the population within the circle. The initial and final cell populations are indicated in gray, red or white circles. Detailed information is described in the text.

Similar articles

Cited by

References

    1. Carroll S.B. Evolution at two levels: on genes and form. PLoS Biol. 2005;3:e245. - PMC - PubMed
    1. Davison E. Genomic Regulatory Systems, Development and Evolution. London: Academic Press; 2001.
    1. Wilkins A.S. The Evolution of Developmental Pathways. Sunderland, MA: Sinauer Associates; 2002.
    1. Li H., Johnson A.D. Evolution of transcription networks–lessons from yeasts. Curr. Biol. 2010;20:R746–753. - PMC - PubMed
    1. Habib N., Wapinski I., Margalit H., Regev A., Friedman N. A functional selection model explains evolutionary robustness despite plasticity in regulatory networks. Mol. Syst. Biol. 2012;8:619. - PMC - PubMed

Publication types