. 2015 Jan 20;112(3):E311-20.
doi: 10.1073/pnas.1416723112. Epub 2015 Jan 6.

Genetic dissection of pheromone processing reveals main olfactory system-mediated social behaviors in mice

Affiliations

Genetic dissection of pheromone processing reveals main olfactory system-mediated social behaviors in mice

Tomohiko Matsuo et al. Proc Natl Acad Sci U S A. .

Abstract

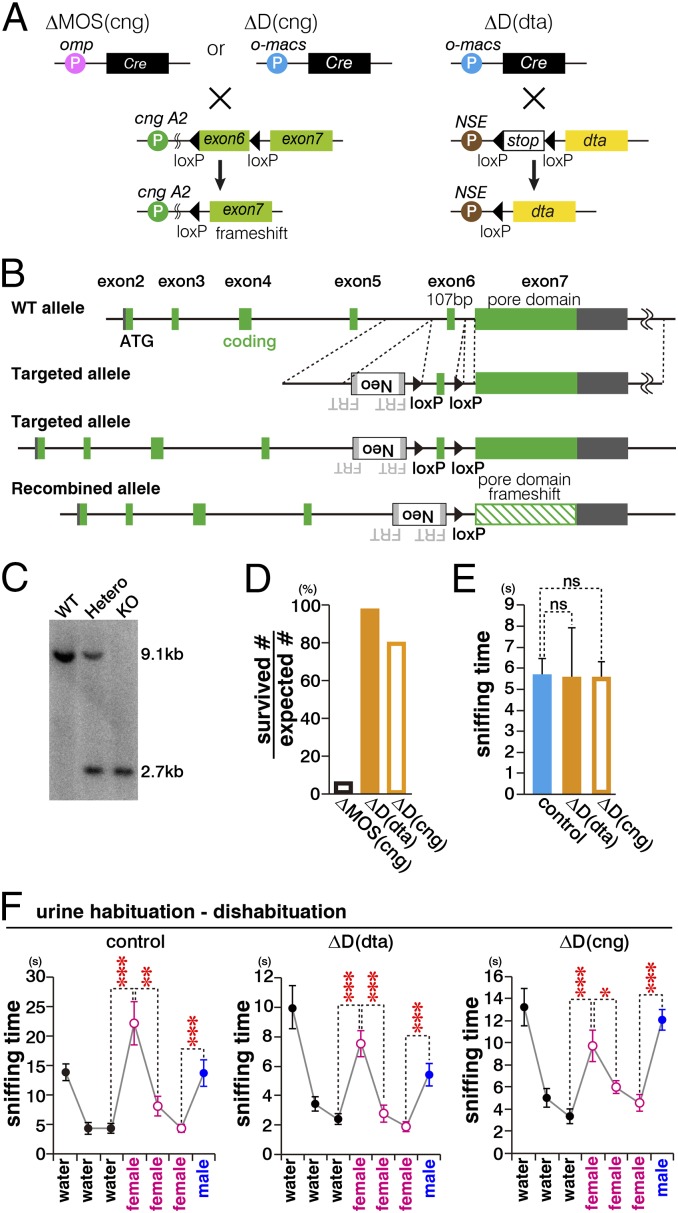
Most mammals have two major olfactory subsystems: the main olfactory system (MOS) and vomeronasal system (VNS). It is now widely accepted that the range of pheromones that control social behaviors are processed by both the VNS and the MOS. However, the functional contributions of each subsystem in social behavior remain unclear. To genetically dissociate the MOS and VNS functions, we established two conditional knockout mouse lines that led to either loss-of-function in the entire MOS or in the dorsal MOS. Mice with whole-MOS loss-of-function displayed severe defects in active sniffing and poor survival through the neonatal period. In contrast, when loss-of-function was confined to the dorsal MOB, sniffing behavior, pheromone recognition, and VNS activity were maintained. However, defects in a wide spectrum of social behaviors were observed: attraction to female urine and the accompanying ultrasonic vocalizations, chemoinvestigatory preference, aggression, maternal behaviors, and risk-assessment behaviors in response to an alarm pheromone. Functional dissociation of pheromone detection and pheromonal induction of behaviors showed the anterior olfactory nucleus (AON)-regulated social behaviors downstream from the MOS. Lesion analysis and neural activation mapping showed pheromonal activation in multiple amygdaloid and hypothalamic nuclei, important regions for the expression of social behavior, was dependent on MOS and AON functions. Identification of the MOS-AON-mediated pheromone pathway may provide insights into pheromone signaling in animals that do not possess a functional VNS, including humans.

Keywords: main olfactory system; pheromone processing; social behavior; vomeronasal system.


Conflict of interest statement

The authors declare no conflict of interest.

Figures

Fig. 1.
Fig. 1.
Preserved detection of odors and pheromones in ΔD mice. (A) Strategy for generating ΔMOS(cng) mice, ΔD(dta) mice, and ΔD(cng) mice. (B) Schematic diagram for generating Cnga2 conditional knockout mice. Following Cre recombination, exon 6 is deleted resulting in a frameshift of exon 7, which contains the channel pore and cAMP binding domains. (C) Verification of homologous recombination by Southern blot analysis. The 9.1-kb band is from the wild-type allele, and the 2.7-kb band is from the targeted allele. (D) Most of the ΔMOS(cng) mice die before weaning (3–4 wk old), whereas ΔD(dta) or ΔD(cng) mice do not. The number of surviving mice at the time of weaning was divided by the expected birth number to calculate survival rate. (E) ΔD(dta), ΔD(cng), and control mice spend similar amounts of time sniffing eugenol (n = 6 for each genotype). (F) Urine habituation-dishabituation test. Graphs present total amount of time (in seconds, s) that male control (n = 8), ΔD(dta) (n = 7), and ΔD(cng) (n = 8) mice spend sniffing a piece of filter paper spotted with water or urine from male or female mice. A decrease or increase in sniffing time indicates that the mice perceive the presented odor to be same as, or different from, the previously presented odor, respectively. O-MACScre/+ mice were used as controls. NSE, neuron-specific enolase, pan-neuronal promoter; dta, diphtheria toxin A. Data are presented as mean + SEM or mean ± SEM; *P < 0.05; **P < 0.01; ***P < 0.001; ns, P > 0.05 (Student’s t test).
Fig. 2.
Fig. 2.
Preserved VNS functions in ΔD mice. (A and B) VNE was stained with Gαi2 and Gαo riboprobes (A) and antibody against OMP (B). (C) Immunohistochemical images of Gαi2 and Gαo in the AOB. (D–F) In situ hybridization analysis of c-fos expression in the AOB (D), MOB (E), and magnified pictures of the dorsal (D) and ventral (V) MOB and of the AOB after exposure to female urine (F) (representative image). (G) Quantification of c-fos expression in the granule cell (GC) and mitral cell (MT) layers of MOB-D, MOB-V, and AOB after exposure to female urine or without odor exposure in control (n = 8), ΔD(dta) (n = 6), ΔD(cng) (n = 8), and VNEx (n = 10) mice. Values from control mice exposed to female urine have been set to 100%; other values are relative to this. (H and I) ΔD(dta) female mice show normal lordosis behavior. Control (n = 9) and ΔD(dta) (n = 11) female mice were exposed to a stud male. The numbers of mountings by male mice (H) and lordosis postures displayed by female mice (I) were measured. (J) Emission of USVs in response to a female intruder was not significantly changed between ΔD(dta) (n = 5) and control (n = 4) female mice. Control and ΔD(dta) female mice were exposed to a hormone-primed ovariectomized female. Control, O-MACScre/+. Data are presented as mean + SEM. *P < 0.05; **P < 0.01; ***P < 0.001; ns, P > 0.05 (Student’s t test in GI, and Student’s t test and Mann–Whitney U test in J).
Fig. 3.
Fig. 3.
Social behavior defects in male ΔD mice. (A) Total amount of time that male control, ΔD(dta), or ΔD(cng) mice spend sniffing male or female urine. (Left) Female urine, n = 7 for each genotype; male urine, n = 8 for each genotype. (Right) Female urine, n = 16 for each genotype; male urine, n = 8 for each genotype. (B) Number of USVs emitted by male control, ΔD(dta), or ΔD(cng) mice following presentation of male or female urine. (Left) control, female urine, n = 22; control, male urine, n = 21; ΔD(dta), female urine, n = 24; ΔD(dta), male urine, n = 24. (Right) n = 10 for each test. (C) Number of USVs elicited from male ΔD(dta) and ΔD(cng) mice by a wild-type male or female intruder. (Left) Control, female, n = 22; control, male, n = 8; ΔD(dta), female, n = 24; ΔD(dta), male, n = 8. (Right) n = 10 for each test. (D and E) Chemoinvestigatory behavior of male ΔD and VNEx mice toward a wild-type male intruder. Total number of sniffs (D) and the percent of all sniffs by area (E) were measured in a resident-intruder test. Control, n = 26 including O-MACScre/+ (n = 21) and sham-operated mice of VNE (n = 5); ΔD(dta), n = 11; ΔD(cng), n = 11; VNEx, n = 11. (FH) Aggressive behaviors displayed by control, ΔD(dta), and ΔD(cng) resident male mice toward a male intruder. The percentages of mice that attack intruders (F), and the number (G) and duration (H) of attacks are shown. (Left) Control, n = 11, ΔD(dta), n = 11; (Right) control, n = 10, ΔD(cng), n = 11. O-MACScre/+ mice were used as controls unless otherwise noted. Data are presented as mean + SEM. *P < 0.05; **P < 0.01; ***P < 0.001; ns, P > 0.05 (Student’s t test in AH). #P < 0.05 (Mann–Whitney U test in AE).
Fig. 4.
Fig. 4.
Social behavior defects in female ΔD mice. (A and B) Chemoinvestigatory behavior of ΔD(dta) female mice was tested. A stud male was introduced into the female home cage. The total number of sniffs was similar between control (n = 9) and ΔD(dta) (n = 11) mice (A), but ΔD(dta) sniffed the head of the intruder most often (B). (CE) Time to pup retrieval by a virgin female control (n = 9) vs. ΔD(dta) (n = 9) (C), control (n = 9) vs. ΔD(cng) (n = 9) (D), and control (n = 11) vs. VNEx (n = 9) (E) mice. (F) Average number of pups surviving to P21 when nursed by control (n = 13) or ΔD(dta) (n = 20) mothers (Left) and distribution of the number of surviving pups at P21 per mother (Right). Sixty percent of ΔD(dta) mothers (12 of 20) neglected the pups, resulting in the death of all pups. (G) The length of the estrous cycle did not differ between control (n = 18) and ΔD(dta) (n = 11) female mice. The estrous cycle phases were determined by vaginal smear tests. (H) Sex hormone levels in serum did not differ between control (n = 8) and ΔD(dta) (n = 7) female mice. O-MACScre/+ mice were used as controls in AD and FH. Sham-operated mice were used as controls in E. Data are presented as mean + SEM. *P < 0.05; **P < 0.01; ***P < 0.001; ns, P > 0.05 (Student’s t test in AH). #P < 0.05 (Mann–Whitney U test in A and B).
Fig. 5.
Fig. 5.
Defects in SBT-triggered activation in the MOB and aversive behaviors in ΔD mice. (A–C) Representative images of in situ hybridization analysis of c-fos mRNA following exposure to SBT and immunohistochemistry of O-MACS staining in the MOB of control (A), ΔD(cng) (B), and ΔD(dta) (C) mice. The O-MACS+ domain is indicated by a brown dot line. Middle and Bottom panels show magnified pictures of the dorsal and lateral glomeruli indicated by blue and orange arrows, respectively. An O-MACS+ glomerulus of control mice (blue arrow) is surrounded by c-fos+ periglomerular cells but not of ΔD(cng) mice in the dorsal domain. (D–F) Unrolled map of activated glomeruli of control (D), ΔD(cng) (E), and ΔD(dta) (F) mice. O-MACS+ dorsal domain is colored blue. Activated glomeruli that are O-MACS+ or O-MACS are depicted in blue or red circles, respectively. Weakly activated glomeruli are pale colored (Materials and Methods). (G–I) Representative images of c-fos mRNA expression following exposure to SBT in the anterior (Upper) and posterior (Lower) sections of the AOB of control (G), ΔD(cng) (H), and ΔD(dta) (I) mice. (J–L) Magnified views of the MOB and AOB. C-fos expression was stronger in the MOB than the AOB of control (J), ΔD(cng) (K), and ΔD(dta) (L) mice. (M and N) Quantification of c-fos expression in the mitral cell (M) and granule cell (N) layers of the AOB. (n = 4 for each genotype) (O) ΔD(cng) mice show increased sniffing time on SBT compared with control mice. Sniffing time was measured during 3 min of SBT exposure [control, n = 7; ΔD(dta), n = 5; ΔD(cng), n = 6]. (P) Number of stretched attend behaviors decreased in ΔD(dta) and ΔD(cng). Stretched attend behavior was counted during 3 min of SBT exposure. (Q) Freezing rate of control (n = 7), ΔD(dta) (n = 5), and ΔD(cng) (n = 6) mice was measured after presentation of no odor, eugenol, or SBT. (R) ΔD(dta) and ΔD(cng) exhibit increased freezing in the presence of SBT after association of SBT with foot shock [control, n = 13; ΔD(dta), n = 8; ΔD(cng), n = 8]. O-MACScre/+ mice were used as controls. Data are presented as mean + SEM. *P < 0.05; **P < 0.01; ***P < 0.001; ns, P > 0.05 (Student’s t test). A, anterior; D, dorsal; FC, fear conditioning; GC, granule cell layer; GL, glomerular layer; MT, mitral cell layer; P, posterior; VL, ventrolateral; VM, ventromedial.
Fig. 6.
Fig. 6.
Reduced c-fos expression in the AON of ΔD(dta) mice in response to estrous-female urine. (A) Representative images of in situ hybridization analysis of c-fos mRNA following exposure to estrous-female urine. aci, anterior commissure, intrabulbar part. (Scale bars, 100 µm.) (B) Levels of c-fos mRNA in the olfactory cortex of ΔD(dta) and VNEx mice, compared with control mice (control values set at 100%) following exposure to estrous-female urine. n = 6–10 for each c-fos value. (C) Schematic illustration showing topographic projections in the olfactory system. The AON maintains a rough dorsal-ventral topography of the MOE-MOB, whereas the APC do not. (D) Locations of sub regions (d, dorsal; l, lateral; v, ventral; m, medial) of the AON are illustrated. (E and F) Levels of c-fos and arc mRNA following exposure to estrous-female urine were quantified in each sub region of the AON shown in D. n = 8 in E and n = 7 in F for each genotype. O-MACScre/+ mice were used as controls. Data are presented as mean + SEM. *P < 0.05; **P < 0.01; ***P < 0.001; ns, P > 0.05 (Student’s t test).
Fig. 7.
Fig. 7.
Deficits in social behavior in mice with lesions of the AON. (A) Total number of sniffs by resident male mice that received sham operations (sham) and by resident ΔAONl male mice, toward a male intruder. (B and C) Number of USVs emitted by male sham and ΔAONl mice presented with urine-spotted paper (B), and in response to male or female intruders (C). (D and E) Resident males were exposed to male intruders. Percent of total sniffs by investigation area (D) and number of attacks (E) were measured over a 15-min period. Sham, n = 7; ΔAONl, n = 8. ΔAON, anterior-olfactory-nucleus lesioned. Data are presented as mean + SEM. *P < 0.05; **P < 0.01; ***P < 0.001; ns, P > 0.05 (Student’s t test in AE). #P < 0.05 (Mann–Whitney U test in AD).
Fig. 8.
Fig. 8.
Induction of c-fos expression in higher brain centers in response to estrous-female urine requires the MOS and AON. (A and B) Representative images of in situ hybridization for c-fos mRNA in the MePD, MePV (A), MPA, and PVN (B) of male control and ΔD(dta) mice exposed to urine from estrous mice. opt, optic tract; och, optic chiasm; 3V, third ventricle. (Scale bars, 100 µm.) (C and D) Percentage of c-fos induction, compared with control mice (horizontal line) in the amygdaloid (C) and hypothalamic nuclei (D) of ΔD(dta), ΔAONl, and VNEx mice following exposure to estrous-female urine. n = 6–10 for each c-fos value. (E) Model of MOS- (blue) and VNS- (red) mediated pheromone pathways in mice. The areas receiving input from both subsystems are colored both red and blue. O-MACScre/+ mice were used as controls. Data are presented as mean + SEM. *P < 0.05; **P < 0.01; ***P < 0.001 (Student’s t test).

References

    1. Boehm U, Zou Z, Buck LB. Feedback loops link odor and pheromone signaling with reproduction. Cell. 2005;123(4):683–695. - PubMed
    1. Lin DY, Zhang SZ, Block E, Katz LC. Encoding social signals in the mouse main olfactory bulb. Nature. 2005;434(7032):470–477. - PubMed
    1. Yoon H, Enquist LW, Dulac C. Olfactory inputs to hypothalamic neurons controlling reproduction and fertility. Cell. 2005;123(4):669–682. - PubMed
    1. Spehr M, et al. Essential role of the main olfactory system in social recognition of major histocompatibility complex peptide ligands. J Neurosci. 2006;26(7):1961–1970. - PMC - PubMed
    1. Yoshikawa K, Nakagawa H, Mori N, Watanabe H, Touhara K. An unsaturated aliphatic alcohol as a natural ligand for a mouse odorant receptor. Nat Chem Biol. 2013;9(3):160–162. - PubMed

Publication types