. 2015 Jan 7:4:e02923.
doi: 10.7554/eLife.02923.

Potassium dependent rescue of a myopathy with core-like structures in mouse

Affiliations

Potassium dependent rescue of a myopathy with core-like structures in mouse

M Gartz Hanson et al. Elife. .

Abstract

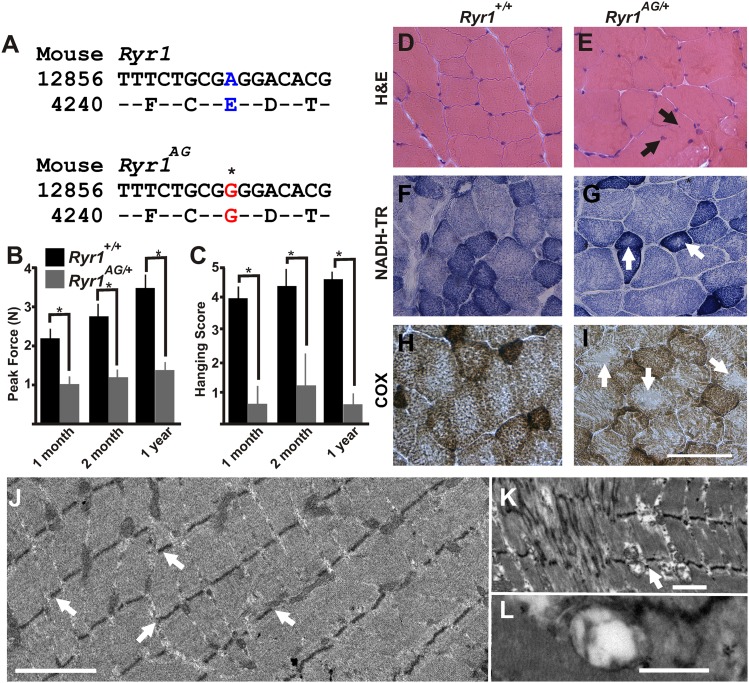
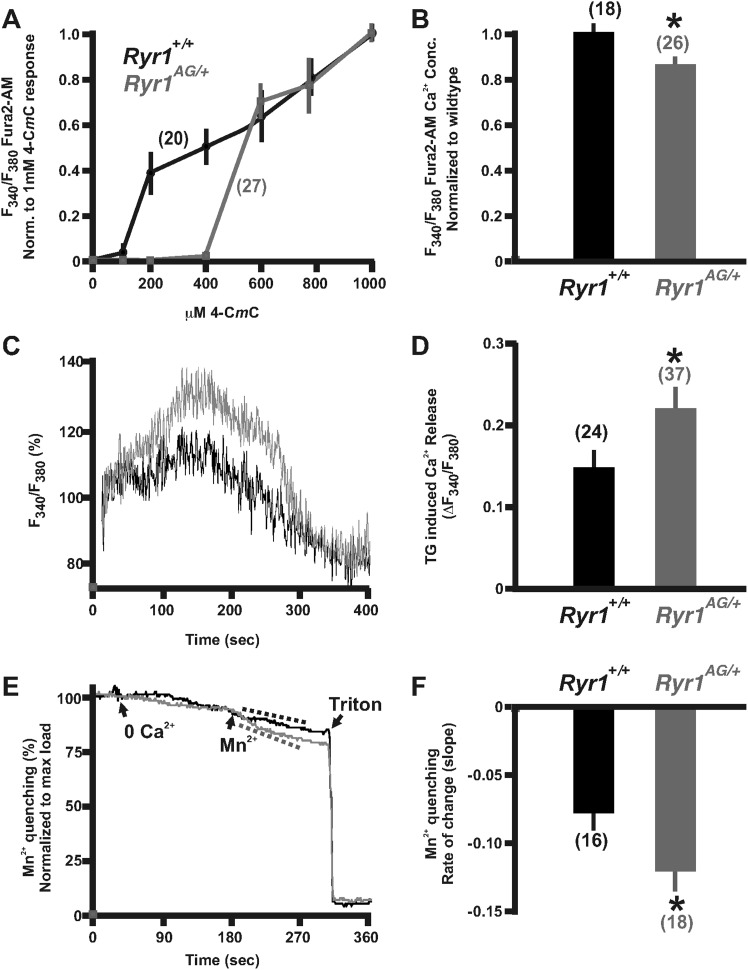
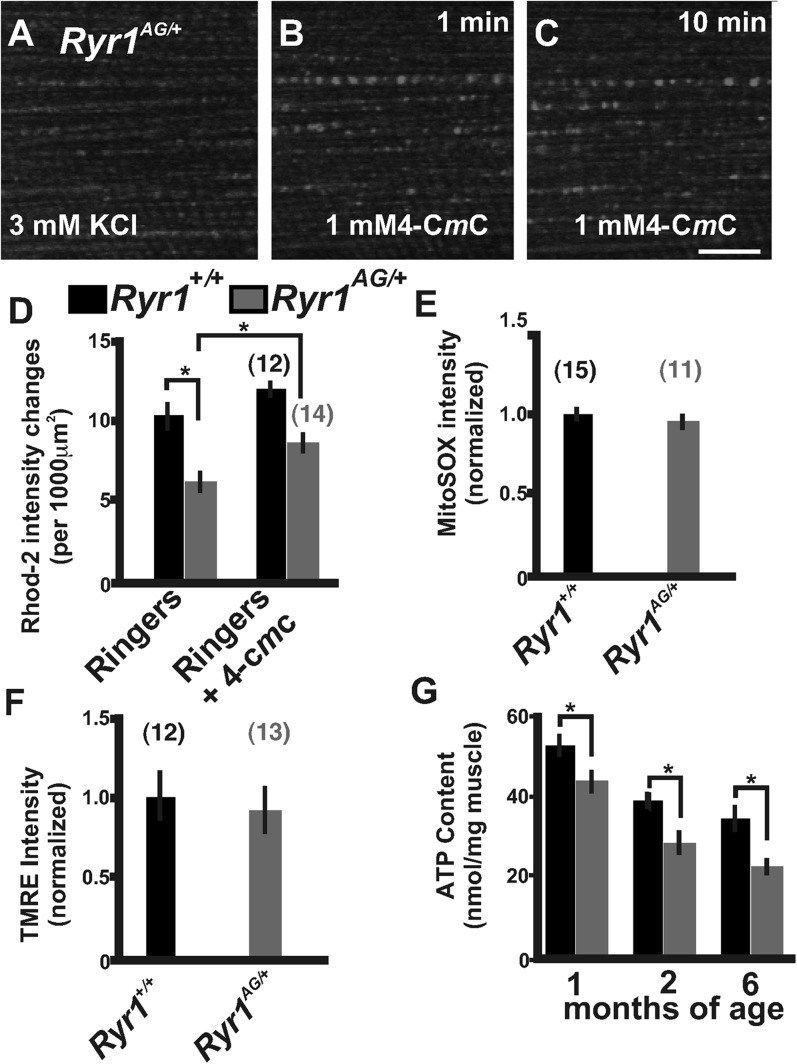
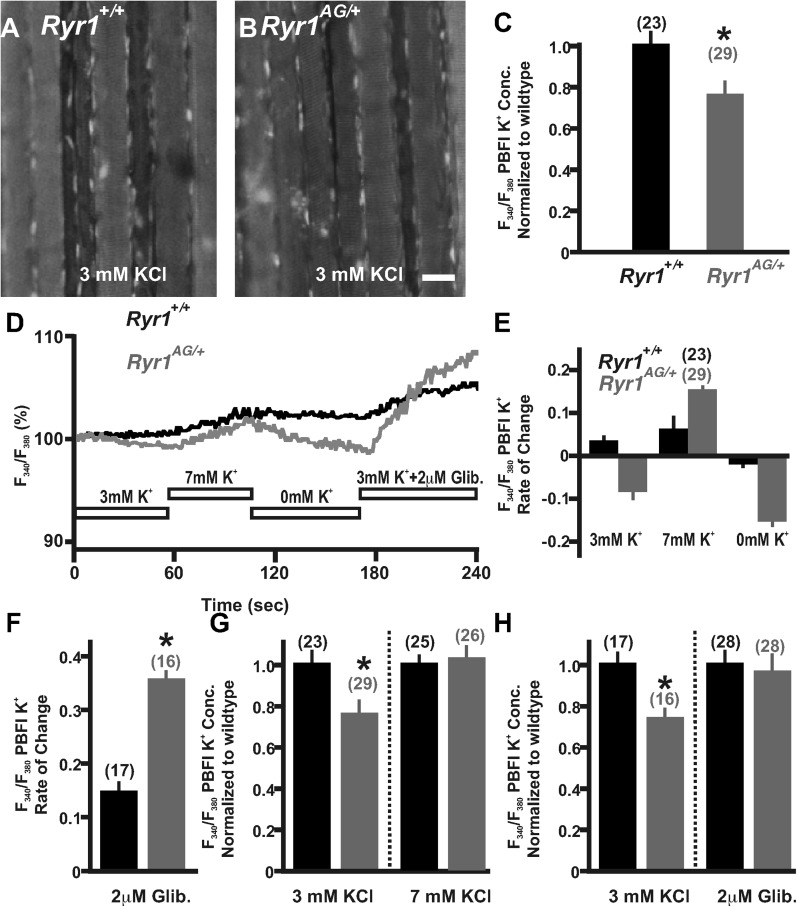
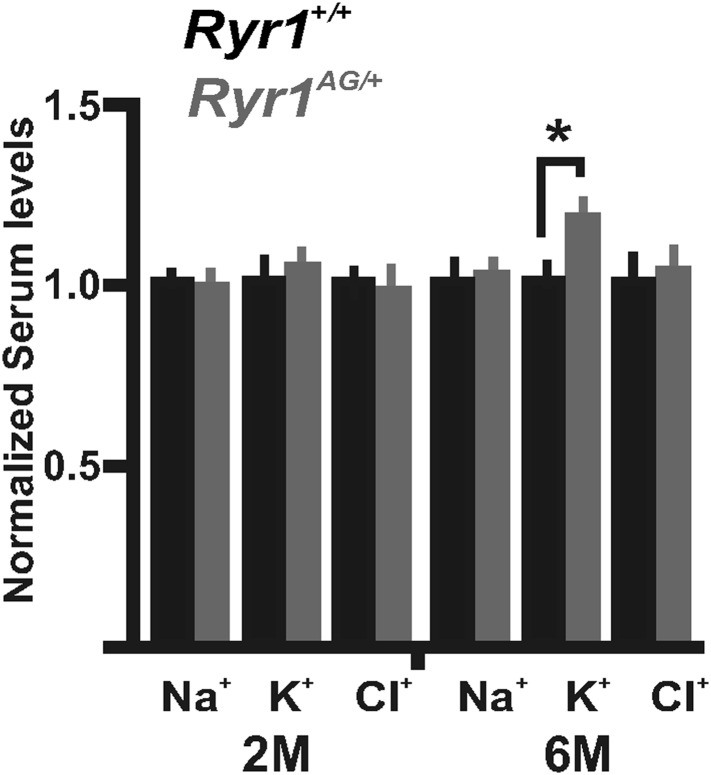
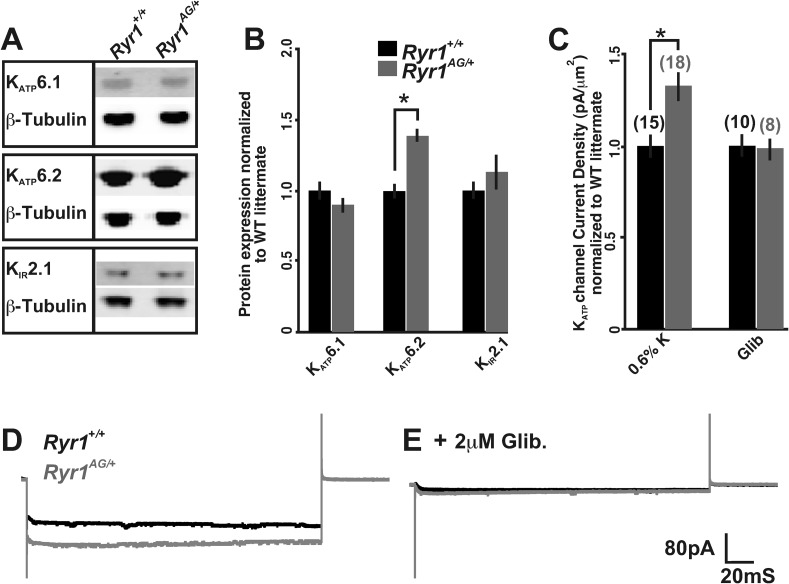
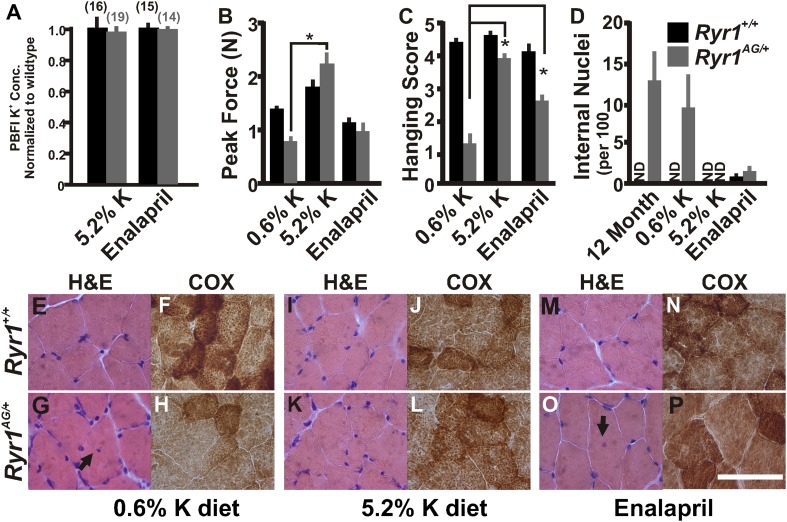
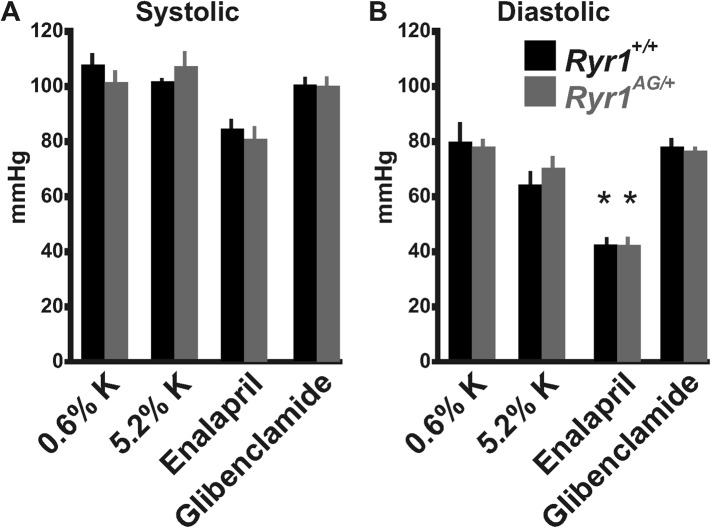
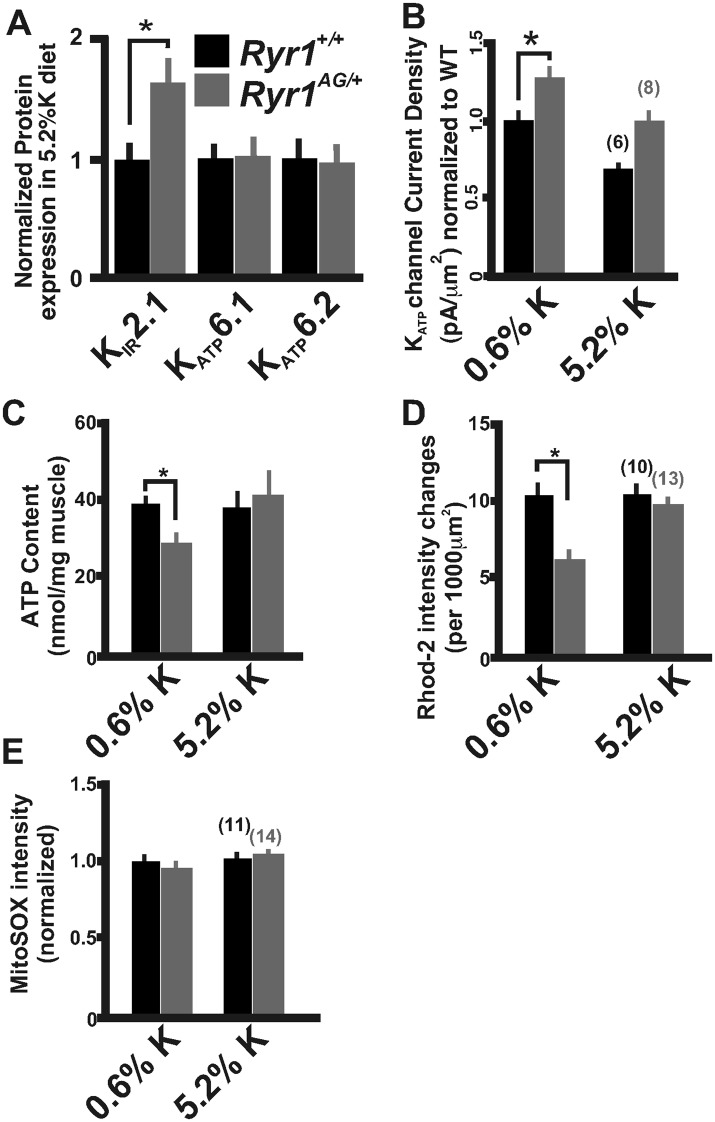
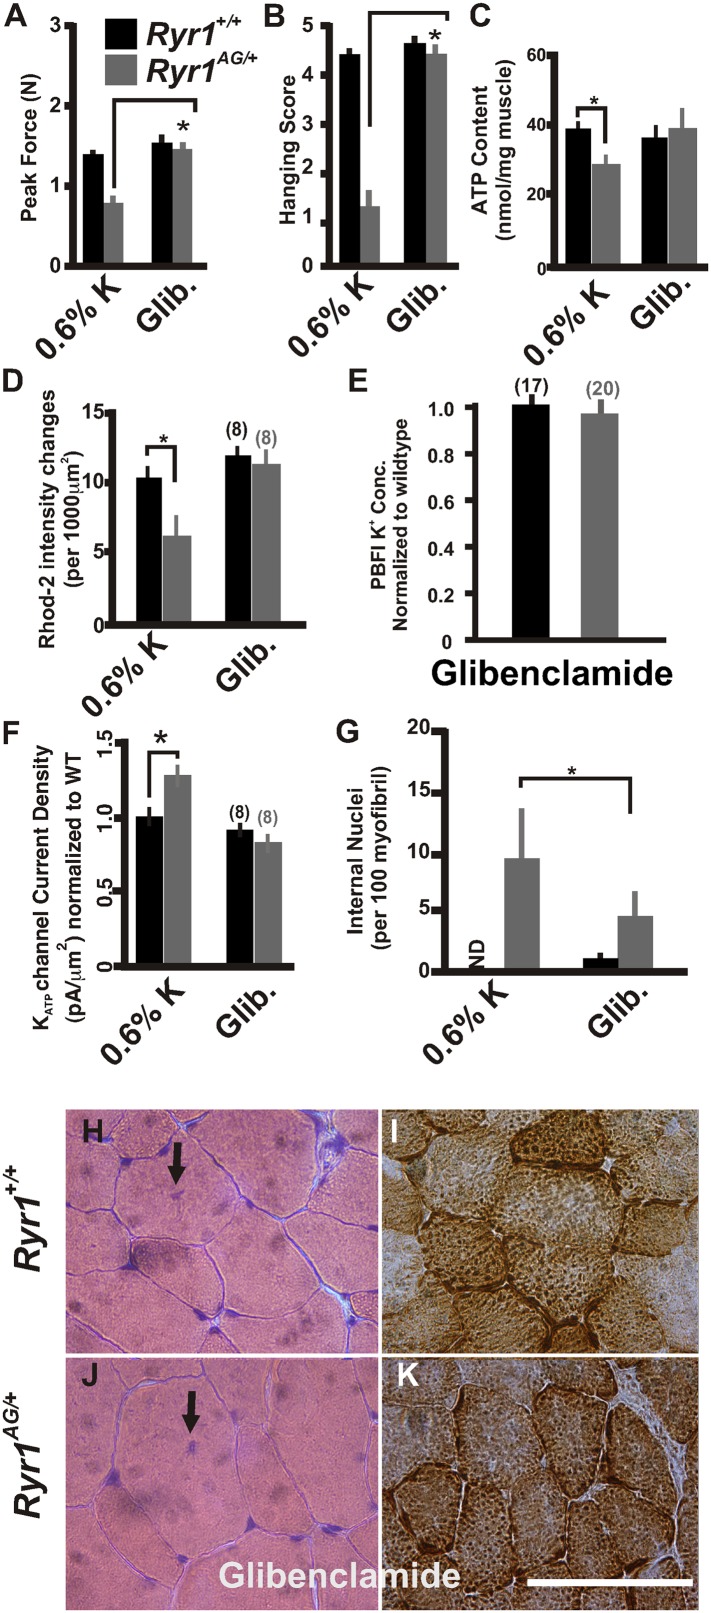
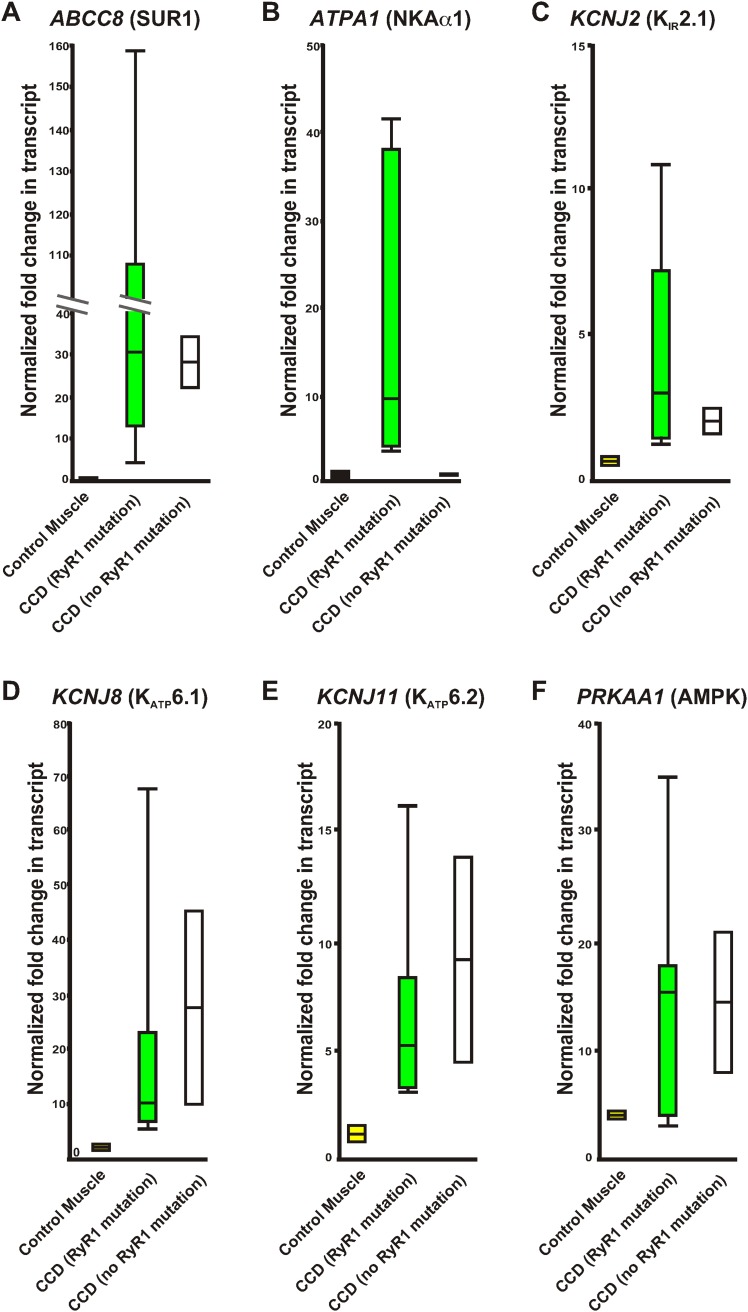
Myopathies decrease muscle functionality. Mutations in ryanodine receptor 1 (RyR1) are often associated with myopathies with microscopic core-like structures in the muscle fiber. In this study, we identify a mouse RyR1 model in which heterozygous animals display clinical and pathological hallmarks of myopathy with core-like structures. The RyR1 mutation decreases sensitivity to activated calcium release and myoplasmic calcium levels, subsequently affecting mitochondrial calcium and ATP production. Mutant muscle shows a persistent potassium leak and disrupted expression of regulators of potassium homeostasis. Inhibition of KATP channels or increasing interstitial potassium by diet or FDA-approved drugs can reverse the muscle weakness, fatigue-like physiology and pathology. We identify regulators of potassium homeostasis as biomarkers of disease that may reveal therapeutic targets in human patients with myopathy of central core disease (CCD). Altogether, our results suggest that amelioration of potassium leaks through potassium homeostasis mechanisms may minimize muscle damage of myopathies due to certain RyR1 mutations.

Keywords: KATP channel; cell biology; congenital myopathy; human; mouse; potassium homeostasis; ryanodine receptor.


Conflict of interest statement

The authors declare that no competing interests exist.

Figures

Figure 1.
Figure 1.. ENU-induced Ryr1AG mutation mimics clinical and pathological features of CCD in heterozygous mice.
(A) Missense mutation in exon 93 of Ryr1 changes A to G, resulting in substitution of glutamic acid with glycine (E4242G). (B) Average grip strength assayed using vertical digital push–pull strain gauge on Ryr1+/+ and Ryr1AG/+ mice at different ages raised on control 0.6% potassium diet. (C) In vivo hanging task determination of upper-body strength of Ryr1+/+ and Ryr1AG/+ mice at different ages (B, C, 10 trials/mouse, n = 5 per set). (D, E) H&E staining indicate central nuclei (arrows) in Ryr1AG/+ (E) but not Ryr1+/+ (D) vastus lateralis muscle from 1-year old mice raised on control 0.6% potassium diet. (F, G) NADH-TR staining indicates cores (white arrows) in 1-year old vastus lateralis of RyR1AG/+ but not Ryr1+/+. (H, I) Cytochrome oxidase (COX) staining denotes a decrease in mitochondrial function (white arrows) in vastus lateralis muscle of Ryr1AG/+ (I) compared to Ryr1+/+ (H). Scale bar = 50 μm. (JL) Transmission electron microscopy of 2-month old Ryr1AG/+ soleus muscle. (J, K) Regions of Z line streaming and associated sarcoplasmic disruption and cores (white arrows) of myofibrils. (L) Enlarged T-tubules are present in type I fibers (scale bars: J = 1 μm; K = 2 μm; L = 0.2 μm ). DOI: http://dx.doi.org/10.7554/eLife.02923.003
Figure 2.
Figure 2.. Calcium homeostasis is disrupted in Ryr1AG/+ muscle.
Fura-2 ratiometric imaging of myoplasmic Ca2+ in 2-month old muscle. (A) Ratiometric analysis of 4-CmC sensitivity in soleus muscles of wild-type (black) and Ryr1AG/+ littermates (grey). (B) Average ratiometric analysis of myoplasmic Fura-2 signal normalized to wild-type signal (n above bar represents number of analyzed fibers). (C) Representative fura-2 ratiometric signal of muscle fibers showing percent change after addition of 20 μM thapsigargin (TG) from wild-type (black) and Ryr1AG/+ (grey) littermate. (D) TG induced maximum response in muscle fibers (n above bar represents number of analyzed fibers). (E, F) Representation and quantification of Mn2+ quenching of Fura-2 fluorescence ratiometric signal illustrating increased influx of store operated calcium entry in soleus muscle fibers of Ryr1AG/+ (grey) muscle fibers compared to wild-type (black) muscle fibers (dash lines represent slope). In (E), arrows indicate when media was introduced with 0 Ca2+ followed by 0.5 mM Mn2+. DOI: http://dx.doi.org/10.7554/eLife.02923.006
Figure 3.
Figure 3.. Defects in mitochondrial function in Ryr1AG/+ mice.
(AC) Representative isolated fiber with Rhod2 fluorescence of 2-month old Ryr1AG/+ in 3 mM KCl (A) and 1 min (B) and 10 min (C) after application of 1 mM 4-CmC (punctate fluorescence are calcium marks). (D) Quantification of mitochondrial calcium marks visualized with Rhod2-AM from isolated soleus muscle fibers from Ryr1+/+ (black bars) and Ryr1AG/+ (gray bars) mice. (E) Superoxide labeling of isolated muscle fibers from Ryr1+/+ and Ryr1AG/+ mice. (F) Intensity of TMRE labeling of isolated soleus muscle fibers from Ryr1+/+ and Ryr1AG/+ littermates with saponin. The numbers on top of bars in graphs represent number of fibers examined. (G) ATP content from Ryr1+/+ and Ryr1AG/+ isolated soleus muscle from age-matched mice (n = 4 for each age and group). Scale bar = 5 μm. DOI: http://dx.doi.org/10.7554/eLife.02923.007
Figure 4.
Figure 4.. Detection and compensation of an internal potassium leak in RyR1AG/+ muscle.
Fluorescence imaging of PBFI at 340 nm in Ryr1+/+ (A) and Ryr1AG/+ (B) soleus muscle in 3 mM Ringer's solutions. (C) Ratiometric potassium imaging obtained at 340 and 380 nm wavelengths provided a ratio of fluorescence in Ryr1+/+ (black) and Ryr1AG/+ (grey) soleus muscle (normalized to Ryr1+/+). (D) Representation of the ratiometric imaging experimental paradigms used in Figure 4 showing bath applications of 3 mM KCl, 7 mM KCl, 0 mM KCl, and 3 mM KCl with 2 μM glibenclamide in Ringer's solutions. (E) Slope of intracellular K+ fluorescence intensities in experimental conditions. (F, H) Normalized intracellular K+ concentration in Ryr1+/+ (black) and Ryr1AG/+ (grey) soleus muscle in 3 mM KCL (F, H) compared to soleus from contralateral limb in 7 mM KCl Ringer's solutions (F) or 3 mM KCL plus 2 μM Glibenclamide (H) (muscle was bathed in solutions for 1.5 hr before imaging, n is the number of fibers examined from four mice). (G) Rate of change in PBFI fluorescence after acute bath application of 2 μM Glibenclamide. Scale bar = 20 μm. DOI: http://dx.doi.org/10.7554/eLife.02923.008
Figure 4—figure supplement 1.
Figure 4—figure supplement 1.. Serum level measurements from Ryr1+/+ (black bars) and Ryr1AG/+ (grey bars) in 2- and 6-month old mice.
Measurements of serum levels were performed on Ryr1+/+ (black bars) and Ryr1AG/+ (grey bars) in 2- and 6-month old mice (n = 6 samples per group per age for Ryr1+/+ and Ryr1AG/+). DOI: http://dx.doi.org/10.7554/eLife.02923.009
Figure 5.
Figure 5.. Altered activity of KATP channels involved in potassium transport.
(A) Western blots of membrane enriched lysate (that lacks mitochondria, peroxisomes, and lysosomes) from 2-month old wild-type and heterozygous Ryr1AG/+ soleus muscle analyzed for KATP6.1, KATP6.2, and KIR2.1. (B) Quantification of protein levels from Western blots of membrane enriched lysates. Each sample was first normalized to its own loading control and then the values from mutant and wild-type on the same blot were compared. Statistical analyses were determined from a minimum of 3 blots and at least two independent samples (n = 4 for each Western). (C) KATP current densities of isolated soleus muscle fibers from 2-month old wild-type and Ryr1AG/+ littermates with and without glibenclamide. Numbers on top of bars are number of fiber recordings. (DE) Representative current density recordings with the same tip resistance from Ryr1+/+ and Ryr1AG/+ soleus muscle fibers (E) with and (D) without 2 μM glibenclamide. DOI: http://dx.doi.org/10.7554/eLife.02923.010
Figure 6.
Figure 6.. Increased potassium diet can rescue muscle strength and reverse the CCD histology and myopathy.
(A) Normalized internal potassium concentrations of soleus muscle from 2-month old Ryr1+/+ and Ryr1AG/+ mice fed 0.6% K+ diet for 4 weeks, then placed on 5.2% K+ diet or 0.6% diet + enalapril for 4 weeks, and then bath exposed to different extracellular potassium concentrations. (B, C) Average grip strength (B, five trials/mouse and 5 mice/set; p values <0.001) and in vivo hanging task (C, 10 trials/mouse, n = 5 per set; p values <0.001) assayed from 2-month old Ryr1+/+ (black bar) and Ryr1AG/+ (grey bar) mice maintained for 4 weeks on control 0.6% K+ diet, 5.2% K+ diet, or 0.6% K+ diet supplemented with enalapril. (D) Quantification of number of internalized nuclei per 100 myofibers in 12-month old mice or in 2-month old mice maintained for 4 weeks on control 0.6% K+ diet, 5.2% K+ diet, or 0.6% K+ diet supplemented with enalapril (n = 10 per muscle, n = 3 per set of muscles for total of n = 30; p values <0.001). (EP) Vastus lateralis myofibers from 2-month old Ryr1+/+ and Ryr1AG/+ mice maintained for 4 weeks on control 0.6% K+ diet, 5.2% K+ diet, or 0.6% K+ diet supplemented with enalapril. Cross-sections stained with H&E (left panels) and COX (right panels). Ryr1AG/+ mice on 5.2% K diet show increased COX staining and no internalized nuclei, similar to Ryr1+/+. These pathological features are still observed in Ryr1AG/+ mice on 0.6% K+ diets. Enalapril increases COX staining but some internalized nuclei are observed, even in Ryr1+/+. Scale bar = 50 μm; error bars as standard error of the mean (SEM). DOI: http://dx.doi.org/10.7554/eLife.02923.012
Figure 6—figure supplement 1.
Figure 6—figure supplement 1.. Blood pressure measurements from Ryr1+/+ (black bars) and Ryr1AG/+ (grey bars) in 2-month old mice.
Non-invasive measurements of systolic (A) and diastolic (B) blood pressure were performed using a Visitec-2000 tail-cuff apparatus. Measurements were taken for 3 days to acclimatize the animals for a more reproducible blood pressure measurement and then the data were collected on day 4. DOI: http://dx.doi.org/10.7554/eLife.02923.013
Figure 7.
Figure 7.. Increased potassium diet influences KATP channel activity and mitochondrial function.
(A) Membrane enriched lysate (lacking mitochondria, peroxisomes, and lysosomes) from soleus muscle of 2-month old Ryr1+/+ and Ryr1AG/+ mice fed 5.2% potassium supplemented diet for 4 weeks analyzed by Western blot for KATP6.1, KATP6.2, and KIR2.1 (* is p < 0.001). (B) KATP current densities of isolated soleus muscle fibers from Ryr1+/+ and Ryr1AG/+ littermates after 4 weeks on 5.2% K diet compared to 0.6% K diet. (C) ATP content from Ryr1+/+ and Ryr1AG/+ isolated soleus muscle from mice on 0.6% or 5.2% potassium diet. (D) Quantification of calcium marks visualized with Rhod2-AM from isolated soleus muscle from Ryr1+/+ and Ryr1AG/+ mice with and without diet therapy. (E) Superoxide labeling of isolated soleus muscle from Ryr1+/+ and Ryr1AG/+ mice with and without therapy. Error bars as standard error of the mean (SEM). DOI: http://dx.doi.org/10.7554/eLife.02923.014
Figure 8.
Figure 8.. Inhibition of KATP channels can reverse the histological and myopathic phenotypes.
(A, B) Average grip strength (A, five trials/mouse and 5 mice/set; p values <0.001) and in vivo hanging task (B, 10 trials/mouse, n = 5 per set; p values <0.001) assayed from 2-month old Ryr1+/+ (black bar) and Ryr1AG/+ (grey bar) mice maintained for 4 weeks on 0.6% K diet and glibenclamide (15 mg/kg/day). (C) ATP content from soleus muscle of Ryr1+/+ and Ryr1AG/+ mice after 4 weeks on 0.6% K diet without or with glibenclamide (n = 4 muscles per condition). (D) Quantification of calcium marks visualized with Rhod2-AM from isolated soleus muscle from Ryr1+/+ and Ryr1AG/+ mice with and without glibenclamide therapy. (E) Normalized internal potassium concentrations after glibenclamide therapy. (F) KATP current densities of isolated soleus muscle fibers from Ryr1+/+ and Ryr1AG/+ littermates after 4 weeks on glibenclamide therapy compared to 0.6% K diet. (G) Quantification of number of internalized nuclei per 100 myofibers in all conditions (n = 10 per muscle, n = 3 per set of muscles for total of n = 30; p values <0.001). (HK) Vastus lateralis myofiber from Ryr1+/+ and Ryr1AG/+ mice maintained for 4 weeks on glibenclamide. Arrow in Ryr1+/+ myofiber (F) shows the rare occurrence of internal nuclei. Cross-sections stained with H&E (left panels) and COX (right panels). Ryr1AG/+ mice on glibenclamide show increased COX staining, similar to Ryr1+/+. Scale bar = 50 μm; error bars as standard error of the mean (SEM). DOI: http://dx.doi.org/10.7554/eLife.02923.015
Figure 9.
Figure 9.. Relative variation of quantitative qRT-PCR of human control RNA and RNA from human muscle biopsies.
Whisker plots derived from the data in Table 2 of control muscle (yellow), congenital myopathy (CCD) with a mutation in RyR1 (green), and without a mutation in RyR1 (white). (A) ABCC8, (B) ATPA1, (C) KCNJ2, (D) KCNJ8, (E) KCNJ11, (F) PRKAA1. Values normalized to GAPDH before normalization to pooled control human muscle RNA. DOI: http://dx.doi.org/10.7554/eLife.02923.017

References

    1. Andersson DC, Betzenhauser MJ, Reiken S, Meli AC, Umanskaya A, Xie W, Shiomi T, Zalk R, Lacampagne A, Marks AR. Ryanodine receptor oxidation causes intracellular calcium leak and muscle weakness in aging. Cell Metabolism. 2011;14:196–207. doi: 10.1016/j.cmet.2011.05.014. - DOI - PMC - PubMed
    1. Andrade F, Trujillo X, Sánchez-Pastor E, Montoya-Pérez R, Saavedra-Molina A, Ortiz-Mesina M, Huerta M. Glibenclamide increases post-fatigue tension in slow skeletal muscle fibers of the chicken. Journal of Comparative Physiology B, Biochemical, Systemic, and Environmental Physiology. 2011;181:403–412. doi: 10.1007/s00360-010-0527-1. - DOI - PMC - PubMed
    1. Baczkó I, Jones L, McGuigan CF, Manning Fox JE, Gandhi M, Giles WR, Clanachan AS, Light PE. Plasma membrane KATP channel-mediated cardioprotection involves posthypoxic reductions in calcium overload and contractile dysfunction: mechanistic insights into cardioplegia. FASEB Journal. 2005;19:980–982. - PubMed
    1. Banas K, Clow C, Jasmin BJ, Renaud JM. The KATP channel Kir6.2 subunit content is higher in glycolytic than oxidative skeletal muscle fibers. American Journal of Physiology Regulatory, Integrative and Comparative Physiology. 2011;301:R916–R925. doi: 10.1152/ajpregu.00663.2010. - DOI - PubMed
    1. Barclay CJ, Woledge RC, Curtin NA. Energy turnover for Ca2+ cycling in skeletal muscle. Journal of Muscle Research and Cell Motility. 2007;28:259–274. doi: 10.1007/s10974-007-9116-7. - DOI - PubMed

Publication types

MeSH terms