. 2014 Dec;6(12):1033-48.
doi: 10.18632/aging.100707.

Stochastic modeling indicates that aging and somatic evolution in the hematopoetic system are driven by non-cell-autonomous processes

Affiliations

Stochastic modeling indicates that aging and somatic evolution in the hematopoetic system are driven by non-cell-autonomous processes

Andrii I Rozhok et al. Aging (Albany NY). 2014 Dec.

Abstract

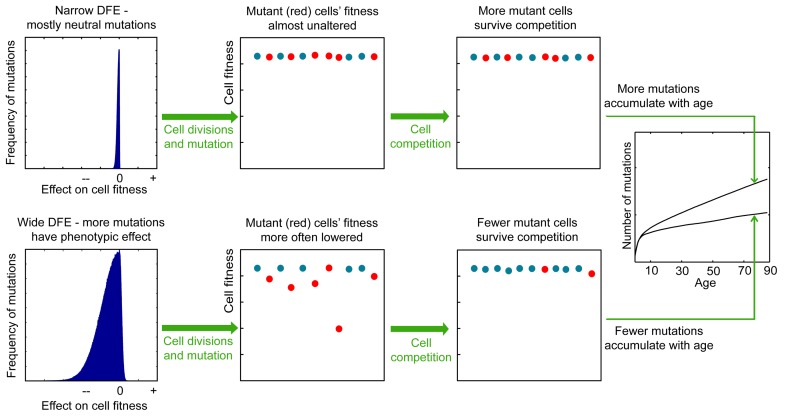
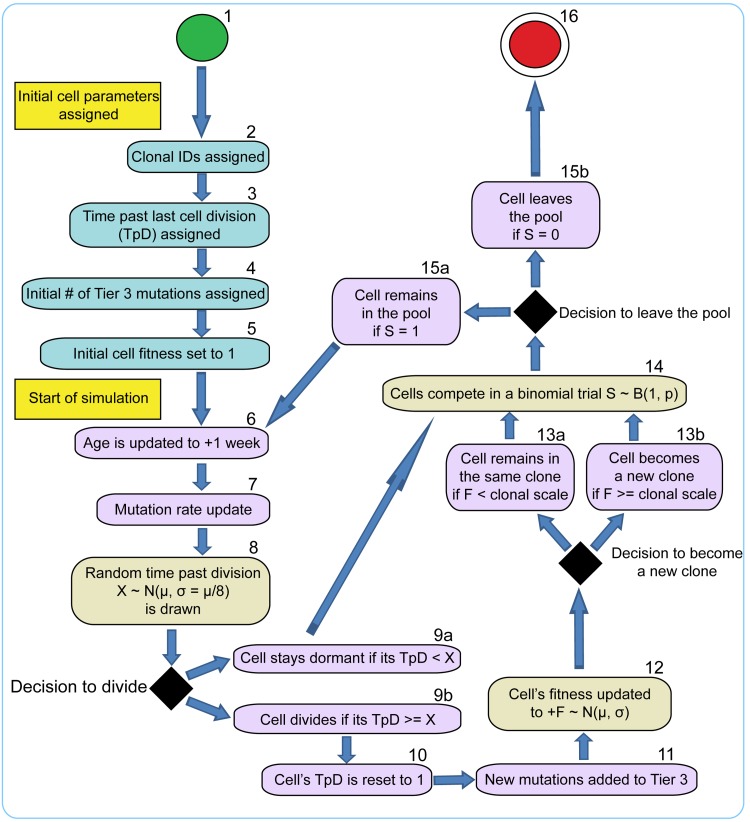
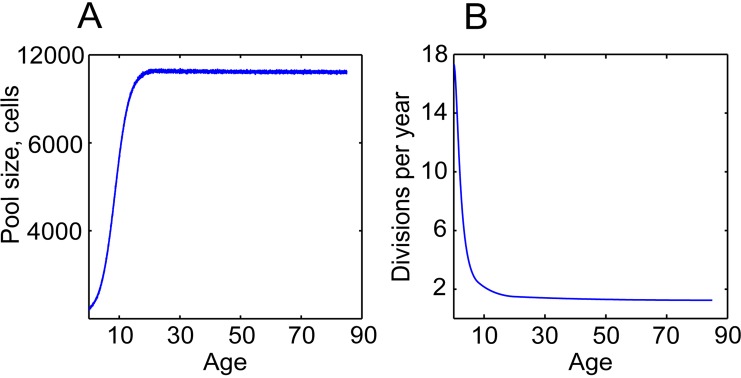
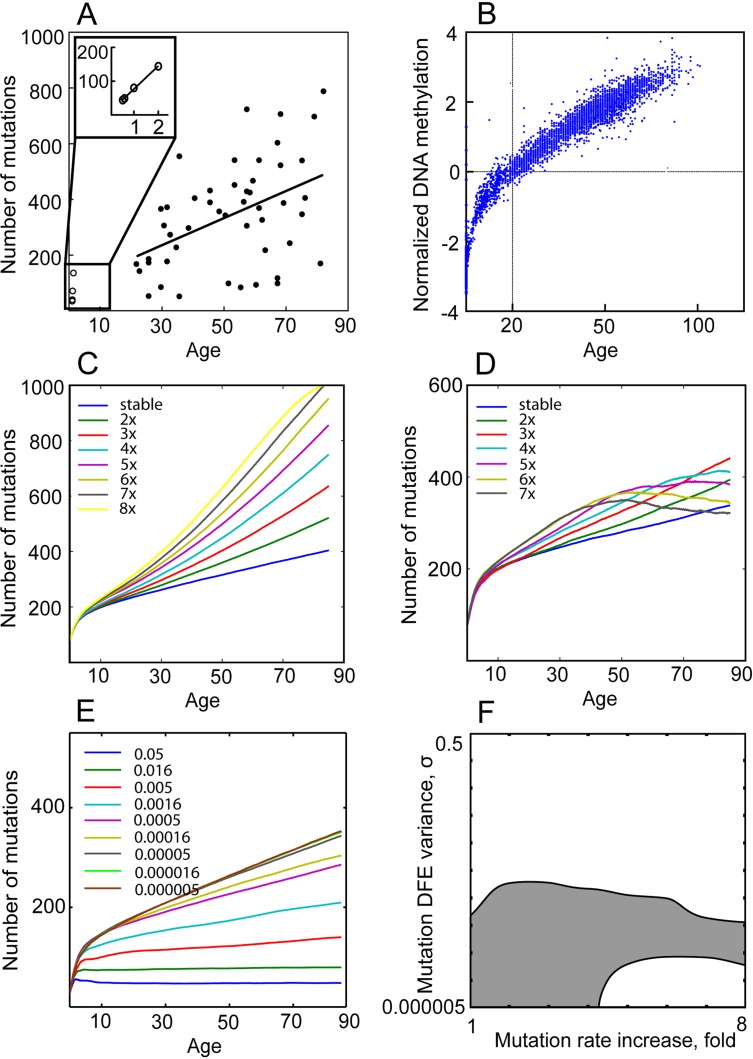
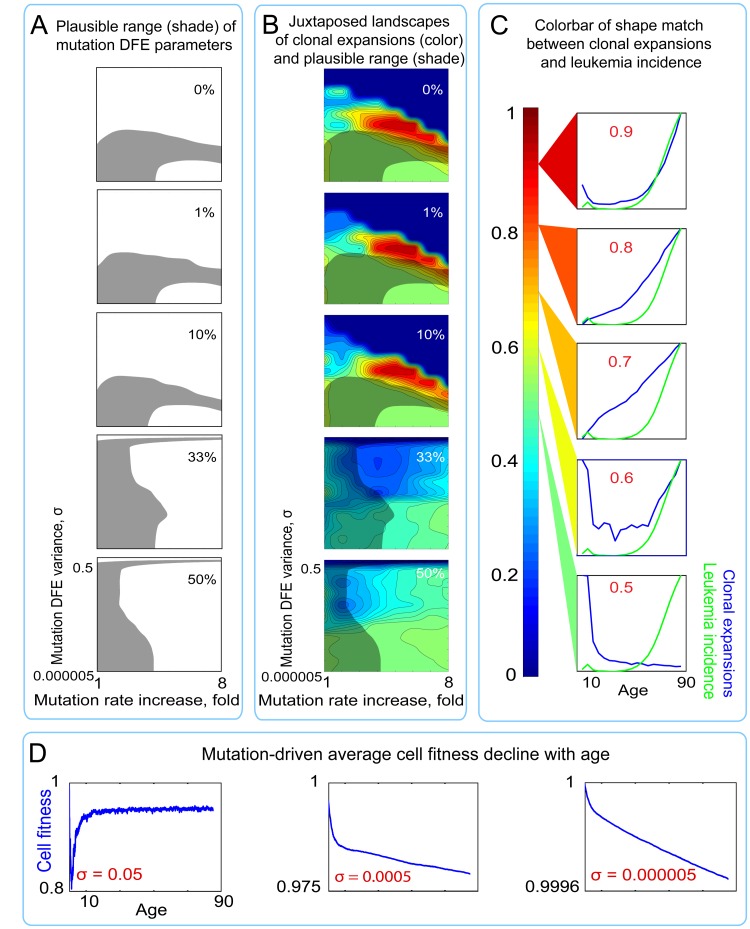
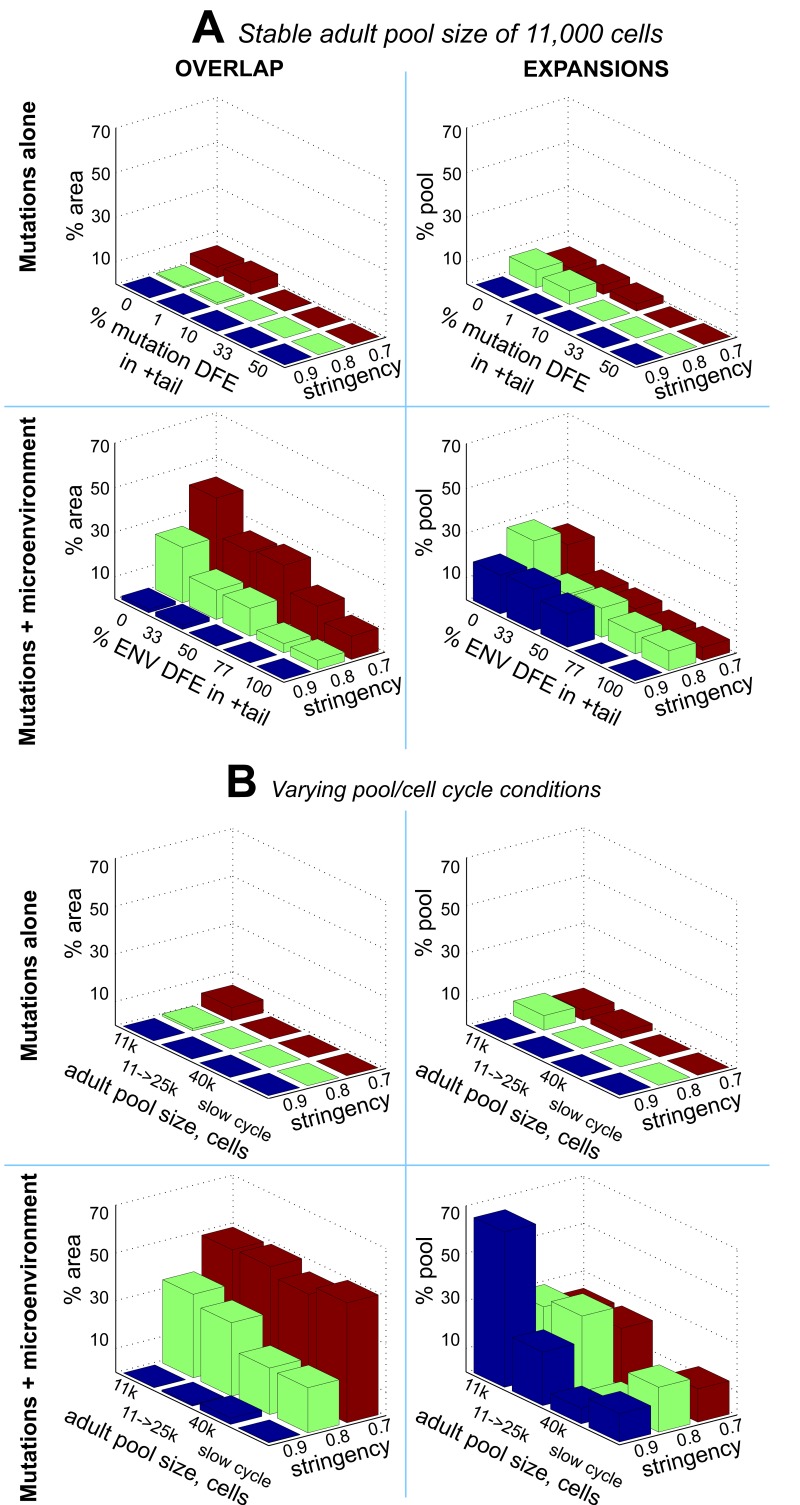
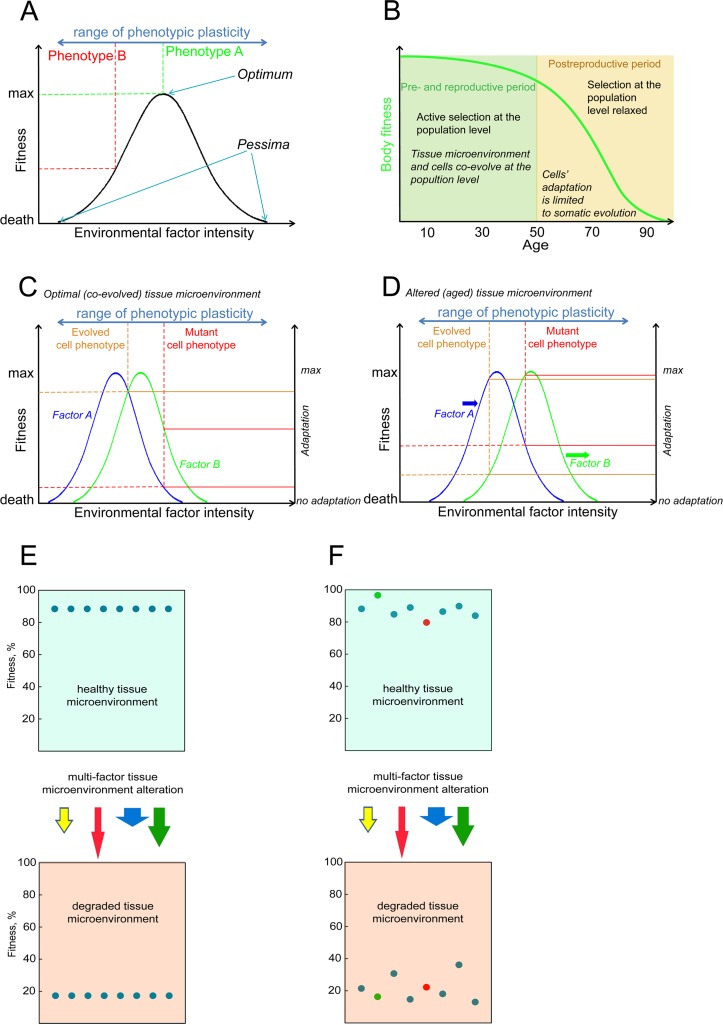
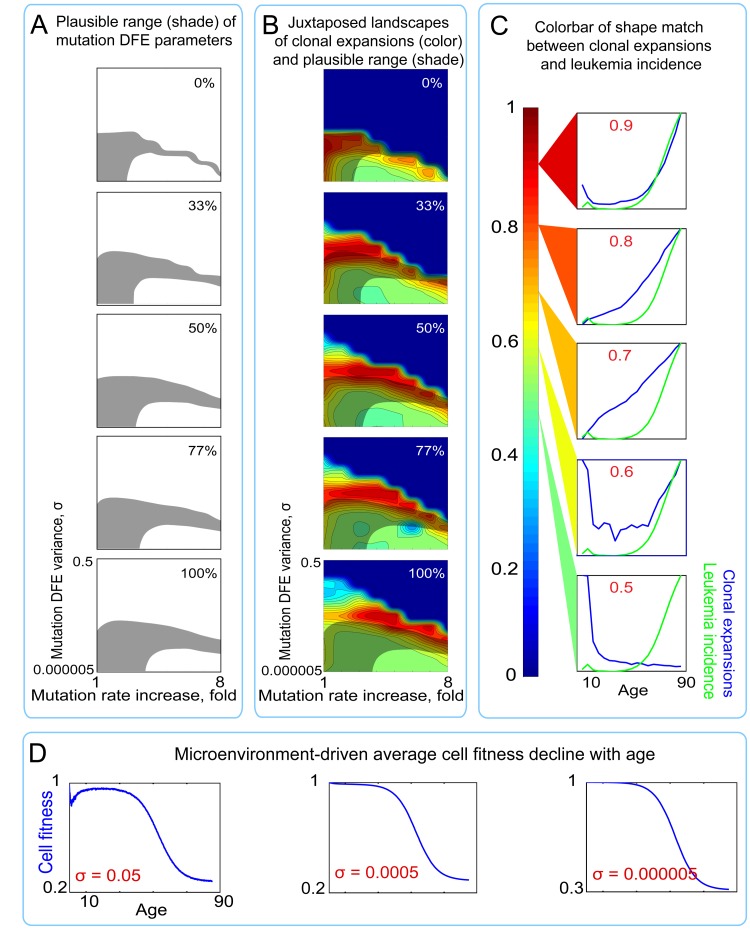
Age-dependent tissue decline and increased cancer incidence are widely accepted to be rate-limited by the accumulation of somatic mutations over time. Current models of carcinogenesis are dominated by the assumption that oncogenic mutations have defined advantageous fitness effects on recipient stem and progenitor cells, promoting and rate-limiting somatic evolution. However, this assumption is markedly discrepant with evolutionary theory, whereby fitness is a dynamic property of a phenotype imposed upon and widely modulated by environment. We computationally modeled dynamic microenvironment-dependent fitness alterations in hematopoietic stem cells (HSC) within the Sprengel-Liebig system known to govern evolution at the population level. Our model for the first time integrates real data on age-dependent dynamics of HSC division rates, pool size, and accumulation of genetic changes and demonstrates that somatic evolution is not rate-limited by the occurrence of mutations, but instead results from aged microenvironment-driven alterations in the selective/fitness value of previously accumulated genetic changes. Our results are also consistent with evolutionary models of aging and thus oppose both somatic mutation-centric paradigms of carcinogenesis and tissue functional decline. In total, we demonstrate that aging directly promotes HSC fitness decline and somatic evolution via non-cell-autonomous mechanisms.


Conflict of interest statement

Conflict of interest statement

The authors of this manuscript declare no conflict of interest.

Figures

Figure 1
Figure 1. The proposed effect of the mutation DFE on the slope of mutation accumulation in stem cell pools with age
Lower panels, a wide DFE leads to a large fitness differential among cells in the pool. Mutations affecting phenotype are known to have mostly negative fitness effects accounting for the large negative tail in the wide DFE. Cells harboring negative mutations will be eliminated by cell competition effects. These cells are likely to be cells that have undergone a greater number of divisions and thereby possess more mutations. Consequently, mutations accumulate more slowly in the population. Upper panels: less frequent non-neutral mutations (a narrow DFE) generate less fitness differential in the pool, and thus the frequency of survival of mutated cells is dominated by drift (chance) rather than selection; the average number of mutations per cell will accumulate faster, at a rate that more closely reflects mutation occurrence and thus cell division frequency.
Figure 2
Figure 2. Stochastic model of HSC cell fate decisions
1 – initial cells (a total of 300); 2-5 – initial cell parameters; 6-15 – cell fate decisions during model cycle updated in “weekly” increments throughout the simulated human 85 year lifespan; 16 – cell leaves the pool. Timing of cells division (8), net fitness change per division (12), and fitness-based competition for niche space (14) are defined in stochastic trials based on distributions of average division timing, mutation DFE, and fitness-dependent stochastic competition scheme, respectively.
Figure 3
Figure 3. HSC division rates and pool size change dramatically throughout life
(A) Dynamics of the pool size; the dynamics were inferred based on postnatal and adult HSC pool size estimates in [49, 72] (B) Average cell division frequencies; modeled based on estimates of HSC division rates at different ages in [20, 21, 49].
Figure 4
Figure 4. Mutation DFE affects the mutation accumulation slope
(A) Mutation accumulation in the Tier 3 genome of AML (see inset for blowup of AMKL in children). (B) DNA methylation accumulation at neutral CpG islands of the human genome with age (from Horvath, 2013). (C-D) Simulated mutation accumulation in Tier 3 under mutation DFE variance σ= 0.000005 (C) and σ= 0.0005 (D) and different mutation rate fold increases over lifetime. (E) Simulated mutation accumulation in Tier 3 under stable mutation rate over lifetime and different mutation DFE variance. (F) The range (shaded) of mutation DFE variance (Y axis) and mutation fold rate increase over lifetime (X axis) that replicate WGS-derived slope of mutation accumulation in AML genomes and DNA methylation accumulation in the hematopoietic tissue within 95% confidence interval.
Figure 5
Figure 5. Landscapes of clonal expansions in the simulated pools under different parameters of mutation DFE when cell fitness is defined by mutations only
(A) Shaded regions represent the plausible range of mutation DFE variance and rate increase over lifetime (for derivation see Fig. 4) under different proportions of mutations in the positive tail of the DFE. (B) Plots of shape match landscapes within the studied ranges of mutation DFE variance (σ; Y-axis) and mutation rate increase (X-axis). Colored landscapes represent age-dependent rates of somatic evolution as shown in the panel C. The proportion of mutation DFE variance in the positive tail is indicated in white text. Plausible ranges of mutation parameters from panel A are compared to mutation parameters that replicate exponentially increasing rates of somatic evolution that shape-match the leukemia incidence curve. (C) Color scale for panel B; colors represent the goodness of shape match between age-dependent leukemia incidence (green line) and simulated clonal expansions (blue line depicts the share of the most successful clone at any given time). (D) Age-dependent average cell fitness decline in the simulated pool for the indicated values of mutation DFE (σ).
Figure 6
Figure 6. Clonal dynamics in the simulated HSC pools under different parameters of mutation and micro-environmental DFEs
OVERLAP (left panels): % area of the plausible range of mutation parameters that allows age-dependent exponential clonal expansions under different stringencies (a minimum of 0.7, 0.8, or 0.9 shape match) of the expansions' match to the reference leukemia curve. ENV DFE – DFE imposed by microenvironment (explained in the text). EXPANSIONS (right panels): average magnitude of clonal expansions under different parameters of mutation and microenvironmental DFEs, measured as the % of pool occupied by the most successful clone at the end of the simulated life. (A) Comparison between mutation-alone (upper panels) and mutations + microenvironment (mutations + ENV) models (lower panels) under a stable adult HSC pool size of 11,000 cells; mutation DFE in the positive tail in all mutation + ENV conditions was set to 0%. (B) Same as A under different adult pool sizes and a slower cell cycling speed estimates (slow cycle); 11k->25k – the adult pool size increases over lifetime from 11,000 to 25,000 cells; mutation DFE in the positive tail in ALL conditions was set to 1% and ENV DFE in the positive tail was set to 0%. Numeric data is presented in Table S1.
Figure 7
Figure 7. A schemata of a phenotype's fitness/survival determination in a complex environment
(A) An illustration of the Shelford's Law of Tolerance: species survival decreases with a change in an environmental factor from the optimum towards its extrema within the species' tolerance range; selection drives adaptation of a species towards best survival optima (occupied by phenotype A in panel A). (B) Body fitness decline in humans and mammals is delayed until the post-reproductive period when selection for high fitness of the body is relaxed; at the animal population level microenvironment integrity is not supported by selection as age advances into the post-reproductive period and cells do not evolve to optimally perform in the altered microenvironment. (C) An example of cell fitness determination within a hypothetical bifactorial tissue microenvironment. The normal cell phenotype evolves for optimal performance at the animal population level, and thus the probability of somatic mutations that enhance cell performance is reduced. The evolved (“normal”) and mutant cell phenotypes have different degrees of adaptation to microenvironmental factors A and B (solid lines connecting to the right “adaptation” axis); following the Sprengel-Liebig Law of the Minimum, fitness of both phenotypes is limited by the factor each phenotype is least adapted to (dashed lines connecting to the left “fitness” axis). (D) An altered microenvironment of aging post-reproductive tissues (factor A and B intensities have changed). Selection at the animal population level is relaxed and neither of the cell phenotypes have evolved to an aged microenvironment (both are out of optima), but the fitness of the mutant phenotype may become higher in the altered microenvironment. (E) A phenotypically homogenous population of cells will decline in fitness in a degraded microenvironment, revealing the microenvironment's uniform component that affects fitness. (F) Phenotypic diversity creates fitness differential in the cell pool. In a degraded microenvironment relative fitness of cells may change and initially disadvantageous mutant phenotypes may gain in fitness relative to others (red cell in panel F) and vice versa (green cell), revealing the microenvironment's stochastic component affecting fitness independently of the initial fitness distribution.
Figure 8
Figure 8. Landscapes of clonal expansions in the simulated pools under different parameters of mutation DFE when cell fitness is modified by microenvironment
(A) Shaded regions represent the plausible range of mutation DFE variance and rate increase over lifetime (for derivation see Fig. 4) under different proportions of mutations in the positive tail of the ENV DFE (B) Plots of shape match landscapes within the studied ranges of mutation DFE variance (σ; Y-axis) and mutation rate increase (X-axis). Colored landscapes represent age-dependent rates of somatic evolution as shown in the panel C. The proportion of ENV DFE variance in the positive tail is indicated in white text. Plausible ranges of mutation parameters from panel A are compared to mutation parameters that replicate exponentially increasing rates of somatic evolution that shape-match leukemia incidence curve. (C) Color scale for panel B; colors represent the goodness of shape match between age-dependent leukemia incidence (green line) and simulated clonal expansions (blue line depicts the share of the most successful clone at any given time). (D) Age-dependent average cell fitness decline in the simulated pool for the indicated values of mutation DFE (σ).

References

    1. Lopez-Otin C, Blasco MA, Partridge L, Serrano M, Kroemer G. The hallmarks of ageing. Cell. 2013;153:1194–1217. - PMC - PubMed
    1. Serrano M, Blasco MA. Cancer and ageing: convergent and divergent mechanisms. Nat Rev Mol Cell Biol. 2007;8:715–722. - PubMed
    1. Hoeijmakers JHJ. DNA Damage, Aging, and Cancer. New England Journal of Medicine. 2009;361:1475–1485. - PubMed
    1. Vijg J, Busuttil RA, Bahar R, Dolle ME. Aging and genome maintenance. Ann N Y Acad Sci. 2005;1055:35–47. - PubMed
    1. Rossi DJ, Bryder D, Zahn JM, Ahlenius H, Sonu R, Wagers AJ, Weissman IL. Cell intrinsic alterations underlie hematopoietic stem cell aging. Proceedings of the National Academy of Sciences of the United States of America. 2005;102:9194–9199. - PMC - PubMed

MeSH terms