. 2016 Jan;8(1):120-31.
doi: 10.1111/1753-0407.12263. Epub 2015 Mar 3.

Regulation of B lymphocyte responses to Toll-like receptor ligand binding during diabetes prevention in non-obese diabetic (NOD) mice

Affiliations

Regulation of B lymphocyte responses to Toll-like receptor ligand binding during diabetes prevention in non-obese diabetic (NOD) mice

Christopher S Wilson et al. J Diabetes. 2016 Jan.

Abstract

Background: Interactions between genetic risk factors and the environment drive type 1 diabetes (T1D). The system of Toll-like receptors (TLR) detects these environmental triggers; however, the target cell that intermediates these interactions to drive T1D remains unknown.

Methods: We investigated the effect of TLR pathway activation (myeloid differentiation primary response 88 [MyD88] vs TIR-domain-containing adapter-inducing interferon-β [TRIF]) on B cell subsets via flow cytometry, including their activation, survival, proliferation, and cytoskeletal mobilization. The effect of polyinosinic-polycytidylic acid (poly(I:C)) on diabetes development was addressed, including the B cell-dependent activation of diabetes-protective DX5+ cells, using genetic models and adoptive transfer.

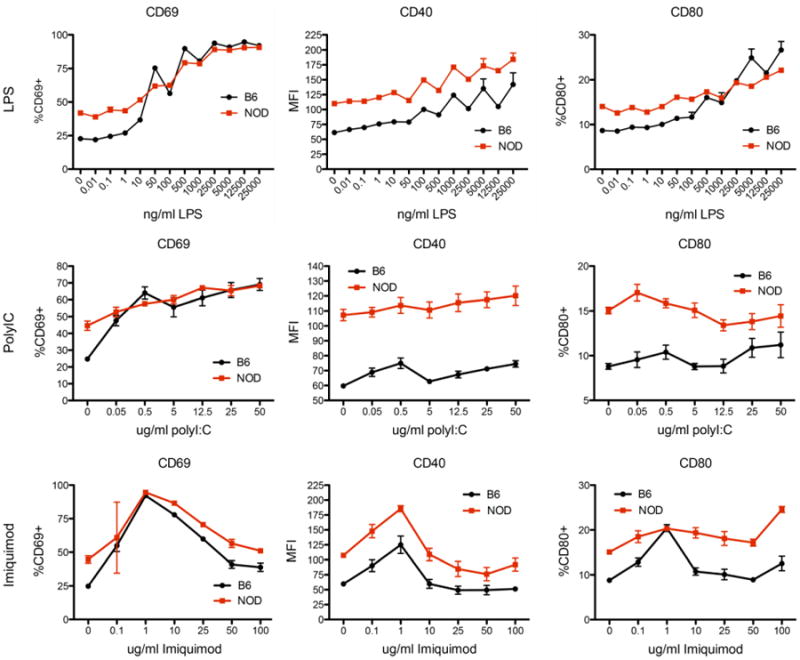
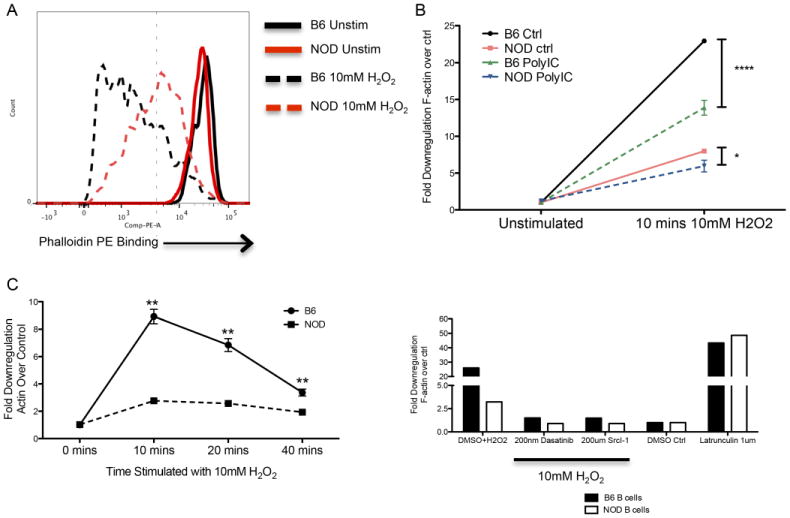
Results: B lymphocytes from non-obese diabetic (NOD) mice expressed enhanced levels of TLR-responsive proteins. Ex vivo analysis of B lymphocyte subsets demonstrated that TLR3 stimulation via TRIF deletes cells exhibiting a marginal zone phenotype, whereas MyD88-dependent ligands enhance their survival. In vivo, marginal zone B cells were activated by poly(I:C) and were unexpectedly retained in the spleen of NOD mice, in contrast with the mobilization of these cells in non-autoimmune mice, a phenotype we traced to defective actin cytoskeletal dynamics. These activated B cells mediated TLR3-induced diabetes protection.

Conclusions: Immunotherapies must account for both B cell location and activation, and these properties may differ in autoimmune and healthy settings.

Keywords: 1型糖尿病; B lymphocyte; B淋巴细胞; Toll-like receptor; Toll样受体; autoimmunity; innate immunity; type 1 diabetes; 先天性免疫; 自身免疫.


Figures

Figure 1
Figure 1. Upregulation of TLR interacting receptors in NOD B lymphocytes
Splenocytes were isolated from pre-diabetic 9-11 week old female NOD mice and matched B6 controls. Cells were immediately stained with B220, CD21, CD23, and the indicated surface marker in the diagram. Overlays of B220+ splenocytes are shown with NOD B cells indicated in blue and B6 in red. NOD mice show an increase in a high expressing population for CD9 (tetraspanin family), CD180 (TLR4/LPS co-receptor, pairs with MD-1), MD-1 (TLR4/LPS co-receptor, paris with CD180), and CD274 (PD-L1). The entire NOD B lymphocyte population shows increased surface expression of CD284 (TLR4) and CD36 (thrombospondin receptor/fatty acid translocase) as indicated by a right shift in the NOD histogram. No differences were seen in the isotype control stains, all of which were clearly negative. The same results were obtained by staining and gating on CD19+ or IgM+ cells. Comparison of staining between CD180, MD-1, CD274, and CD9 was performed based on determination of percent positive cells; differences were significantly different between all groups (p<0.0001, ANOVA followed by post test, n>3 for all). For CD36 and TLR4, comparison was made based on the population MFI and was also statistically significant (p<0.0001 for CD36 and p<0.05 for TLR4, t-test, n>3 for both). The figure is representative of at least two independent experiments in all cases.
Figure 2
Figure 2. The dynamic response of B lymphocytes to TLR engagement
Splenocytes were isolated from pre-diabetic female NOD mice and matched B6 controls. Cells were cultured overnight in the presence of TLR agonists including LPS (TLR4), polyIC (TLR3) and imiquimod (TLR7). After overnight culture, cells were harvested, stained with B220, CD40, CD69, and CD80. Data is demonstrated as percent positive cells for CD69 and CD80. For CD40, the population MFI is shown as all B cells were positive. Measurement of all markers shows greater staining in NOD B lymphocytes at baseline as compared to B6. Following stimulation, B6 B lymphocytes largely achieve the same maximal activation as measured for NOD. In the case of CD40 surface expression, the baseline difference appears maintained throughout a range of stimulation conditions, which follow identical dynamics between the strains. For other comparisons, the baseline difference is the largest difference observed. For all comparisons shown, the responses of the two strains are statistically different as assessed by ANOVA (p<0.01 for all); this difference is largely attributable to the baseline difference, which is lost at higher levels of stimulation particularly for CD69. Data are obtained from 3 separate experiments; n=6 for all doses demonstrated.
Figure 3
Figure 3. The differential response of marginal zone B cells to MyD88 dependent and independent TLR pathways
Splenocytes were isolated from 9-11 week old, pre-diabetic female NOD mice and age-matched B6 controls. The baseline percentage of marginal zone and follicular B cells were obtained by staining with B220, CD19, CD21, and CD23. Cells were cultured overnight in the presence of the indicated concentration of LPS, imiquimod, or polyIC. After culture, cells were again stained and the percentage of follicular and marginal zone B cells calculated. The graphs display the ratio of the percent cell type identified at the end of culture to that present at the beginning. A ratio of 1 indicates no change in the relative cell proportion in the culture. Examining the unstimulated condition, marginal zone B cells stability is similar between strains in overnight culture whereas NOD follicular zone B cells are relatively better retained. Stimulation with LPS, which depends on all major TLR adaptors, shows increased retention of the marginal zone phenotype in NOD mice in a dose responsive pattern. B6 mice show a modest effect in the marginal zone and show significantly improved maintenance of follicular B cells. The pattern is similar with imiquimod, which depends only on MyD88, as NOD marginal zone B cells are more persistent in culture following increased stimulation; conversely follicular zone B cells are decreased by increasing imiquimod concentration. PolyIC, which depends upon TRIF, shows an opposite effect in the marginal zone, where both NOD and B6 cells are diminished by treatment. PolyIC shows little effect on the follicular zone. Data are from 3 separate experiments. (n=9 per strain; p<*0.05,**0.01,***0.001,****0.0001, ANOVA followed by Bonferroni post-test). Statistics are shown comparing NOD to B6 at baseline; other comparisons are for the stimulated condition for the given strain to its own baseline.
Figure 4
Figure 4. PolyIC injection prevents Type 1 diabetes but does not deplete the marginal zone in vivo
(A). 9-10 week old female NOD mice were given daily injections of 100ug polyIC for 9 days. Mice were followed for the development of diabetes. PolyIC treated mice demonstrated significant diabetes protection (**p<0.0001, log-rank). N=10 in each group. (B) After a 9 day course of 100ug polyIC injections, spleens were obtained from NOD and B6 mice and analyzed for marginal zone B cells by staining with B220, CD19, CD21, and CD23. B6 B cells showed an expected decrease in the presence of marginal zone B cells as compared to baseline (*p<0.05 ANOVA, followed by Bonferroni post-test). Unexpectedly, no change was identified in the marginal zone compartment in NOD B cells. Similar results were obtained when staining with CD1d and IgD was used instead. Panel B is representative of 5 different experiments and combined results are shown in the histogram.
Figure 5
Figure 5. Attenuated actin cytoskeletal dynamics in NOD B lymphocytes
(A) Splenocytes from pre-diabetic NOD and matched B6 mice were stimulated for 10 minutes with 10mM hydrogen peroxide (H2O2). F-actin de-polymerization was measured by flow cytometry in B220 positive cells by co-staining with rhodamine-phalloidin. A representative diagram of the actin response is shown. At baseline, phalloidin staining is consistent between strains. Following stimulation, B6 lymphocytes show a significantly more dynamic response of the actin network as indicated by a greater left shift. (B) The response of the actin cytoskeleton is presented as a fold decrease in phalloidin staining compared to baseline. The effect of polyIC was assessed by injection of the mice with 100ug of polyIC 6h prior to the activation assay. Marginal zone B cells (identified by CD21/23) in B6 mice show an over 25-fold reduction in staining compared to a maximal 8-fold reduction in NOD mice. Exposure to polyIC decreases this response in both strains. However, the B6 response remains significantly greater than NOD and the NOD response is reduced to nearly baseline levels (p<*0.05 or ****0.0001, ANOVA followed by Bonferroni post-test). (C). The kinetics of the response were also assessed. Stimulation with hydrogen peroxide results in maximal response at 10 minutes which returns to near baseline in B6 mice by 40 minutes. NOD B lymphocytes show similar kinetics with severely reduced amplitude (**p<0.005, ANOVA followed by post-test). (D). The measured actin response is regulated by normal signaling pathways. Addition of the broad kinase inhibitor dasatanib or by the more selective SRC family inhibitor Src-Inhibitor I prevents the depolymerizing response induced by H2O2 to nearly baseline levels as compared to control. Addition of the actin depolymerizing toxin latrunculin shows the capacity for NOD B lymphocytes to demonstrate complete de-polymerization. Data shown are representative of at least three independent experiments.
Figure 6
Figure 6. B cell dependent induction of diabetes protection
DX5+ cells were isolated from either polyIC treated NOD mice (n=8, squares) or polyIC treated B cell deficient NOD.mMT mice (n=8, triangles). In treated mice, 100ug polyIC was given daily for 9 days. 1 million DX5+ cells were transferred along with 20 million splenocytes from a diabetic donor into NOD/scid recipients. The time to diabetes was also compared to control NOD mice that received diabetic splenocytes alone (n=12, circles). Blood sugars were followed twice weekly until diabetes developed. Cells from NOD mice protected against diabetes development (*p<0.05 NOD/polyIC vs Ctrl) whereas the same cells from B cell deficient donors lost their capacity to prevent diabetes transfer (**p<.05 vs NOD/polyIC, log rank). Data are from two separate experiments.

References

    1. Orban T, Sosenko JM, Cuthbertson D, et al. Pancreatic islet autoantibodies as predictors of type 1 diabetes in the Diabetes Prevention Trial-Type 1. Diabetes Care. 2009;32:2269–74. - PMC - PubMed
    1. Ziegler AG, Rewers M, Simell O, et al. Seroconversion to multiple islet autoantibodies and risk of progression to diabetes in children. Jama. 2013;309:2473–9. - PMC - PubMed
    1. Hu CY, Rodriguez-Pinto D, Du W, et al. Treatment with CD20-specific antibody prevents and reverses autoimmune diabetes in mice. J Clin Invest. 2007;117:3857–67. - PMC - PubMed
    1. Pescovitz MD, Greenbaum CJ, Krause-Steinrauf H, et al. Rituximab, B-lymphocyte depletion, and preservation of beta-cell function. N Engl J Med. 2009;361:2143–52. - PMC - PubMed
    1. Henry RA, Kendall PL, Thomas JW. Autoantigen-specific B-cell depletion overcomes failed immune tolerance in type 1 diabetes. Diabetes. 2012;61:2037–44. - PMC - PubMed

Publication types