. 2015 Jan 6;21(1):65-80.
doi: 10.1016/j.cmet.2014.12.005.

Pyruvate kinase M2 regulates Hif-1α activity and IL-1β induction and is a critical determinant of the warburg effect in LPS-activated macrophages

Affiliations

Pyruvate kinase M2 regulates Hif-1α activity and IL-1β induction and is a critical determinant of the warburg effect in LPS-activated macrophages

Eva M Palsson-McDermott et al. Cell Metab. .

Erratum in

Abstract

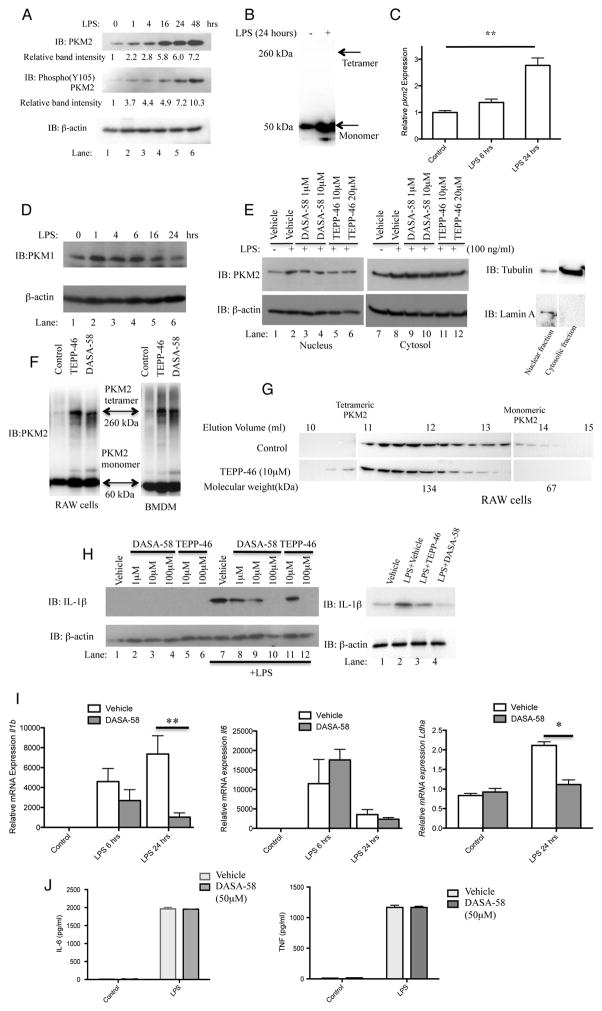
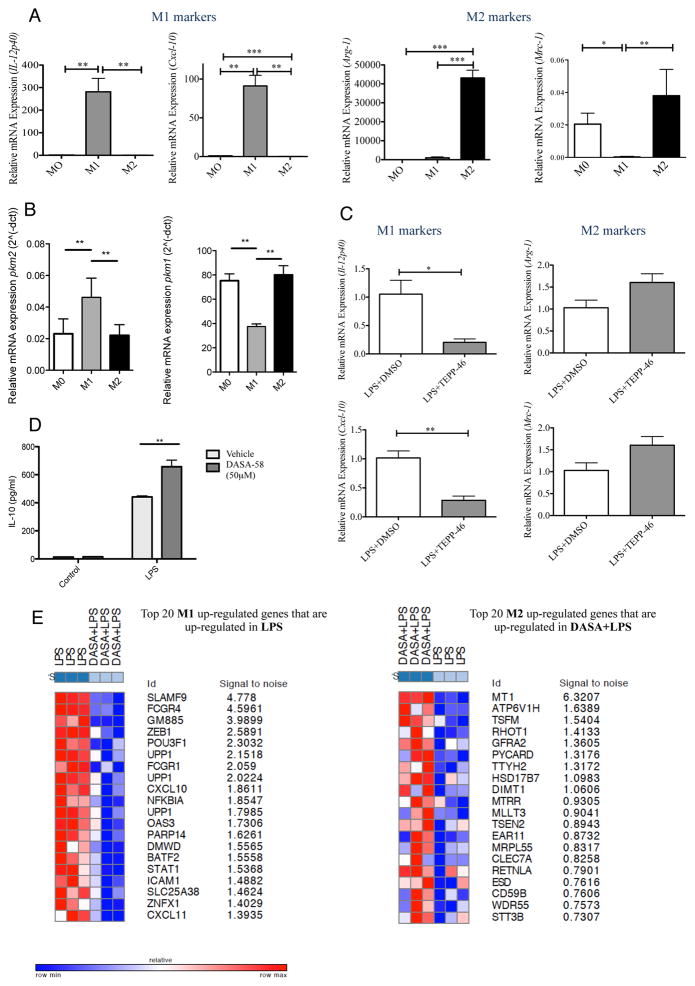
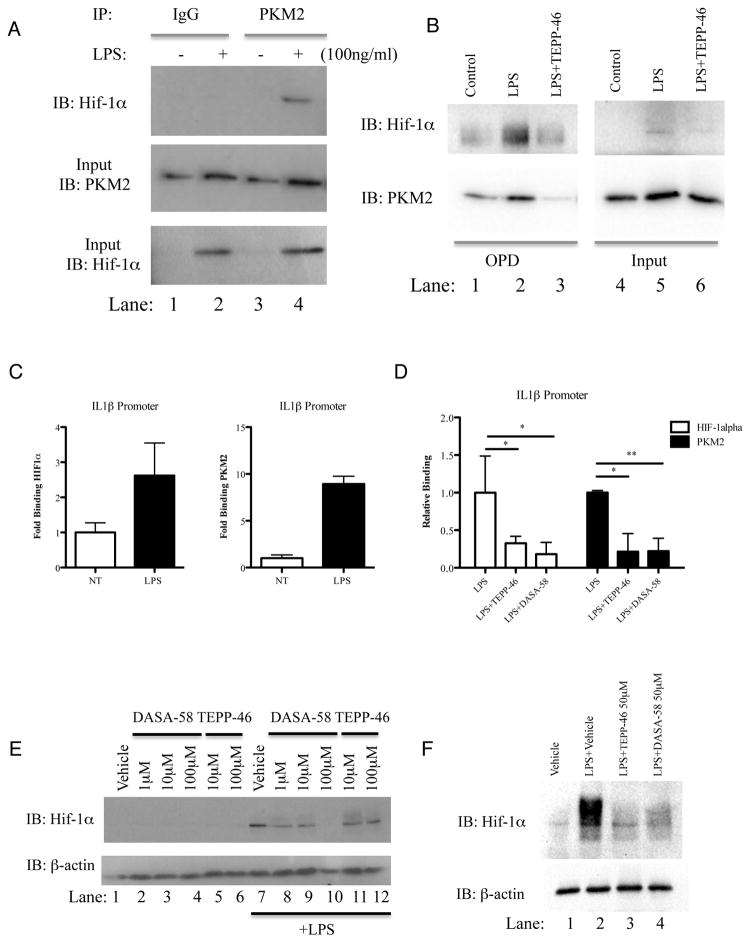
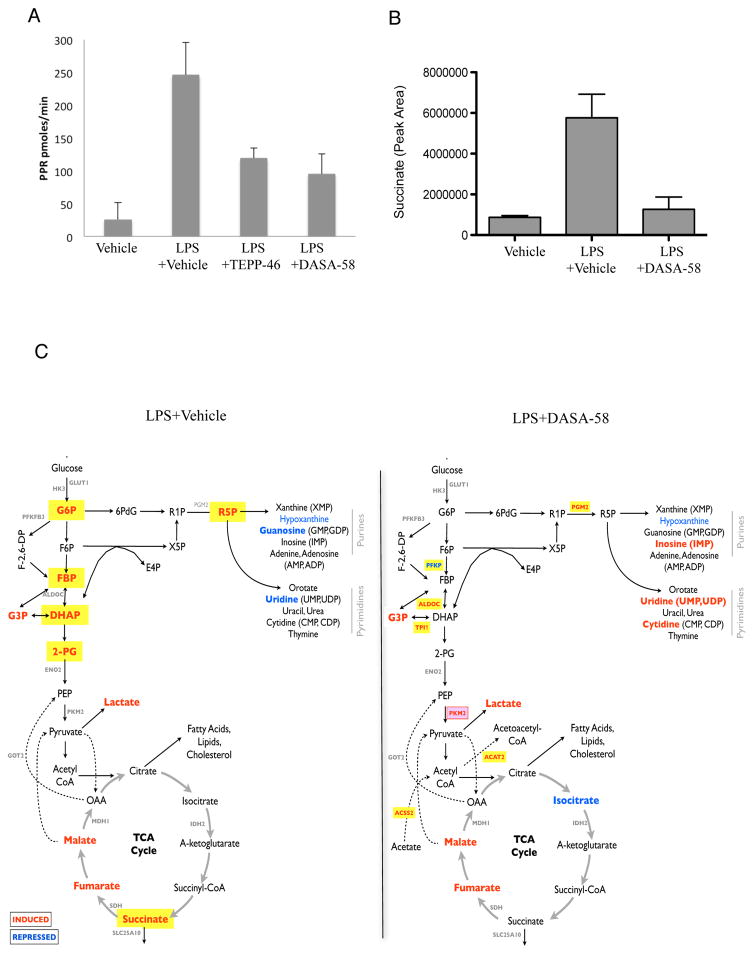
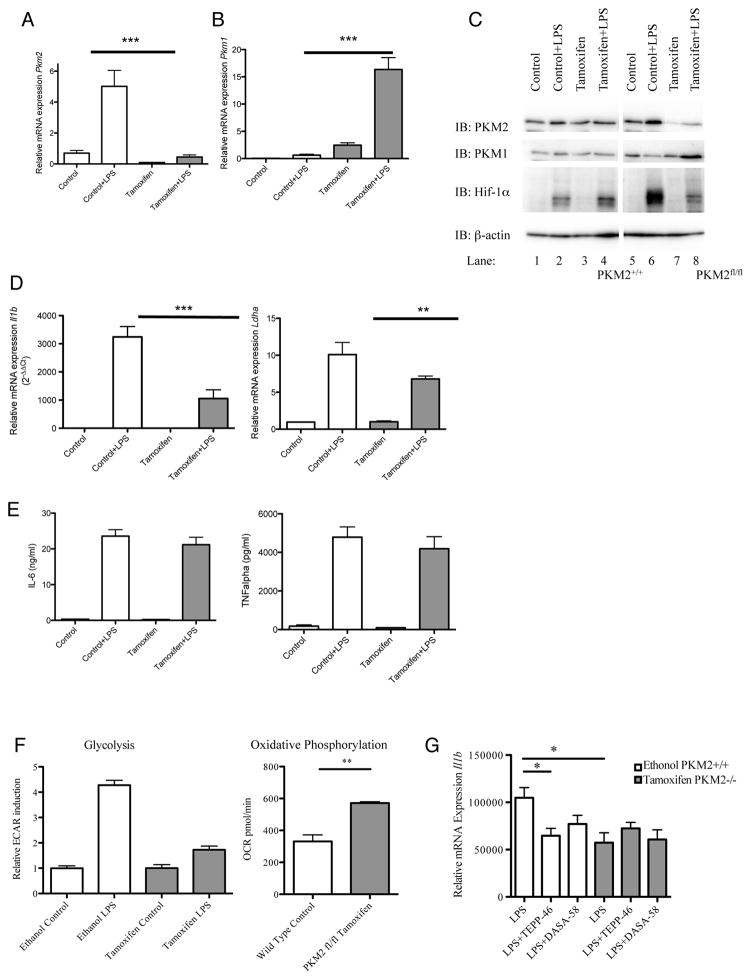
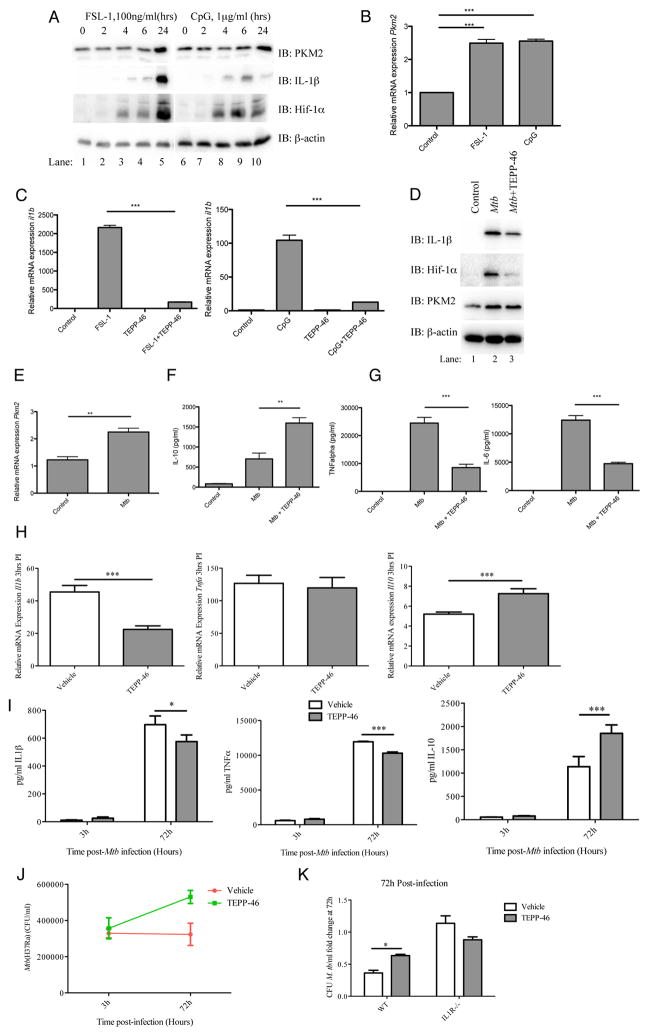
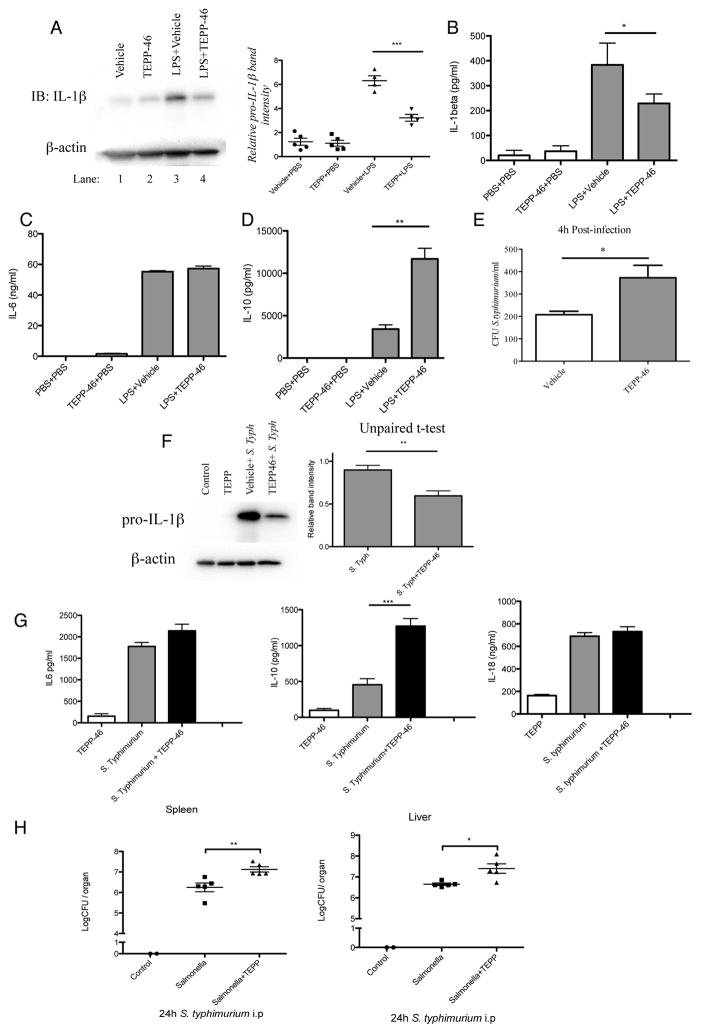
Macrophages activated by the TLR4 agonist LPS undergo dramatic changes in their metabolic activity. We here show that LPS induces expression of the key metabolic regulator Pyruvate Kinase M2 (PKM2). Activation of PKM2 using two well-characterized small molecules, DASA-58 and TEPP-46, inhibited LPS-induced Hif-1α and IL-1β, as well as the expression of a range of other Hif-1α-dependent genes. Activation of PKM2 attenuated an LPS-induced proinflammatory M1 macrophage phenotype while promoting traits typical of an M2 macrophage. We show that LPS-induced PKM2 enters into a complex with Hif-1α, which can directly bind to the IL-1β promoter, an event that is inhibited by activation of PKM2. Both compounds inhibited LPS-induced glycolytic reprogramming and succinate production. Finally, activation of PKM2 by TEPP-46 in vivo inhibited LPS and Salmonella typhimurium-induced IL-1β production, while boosting production of IL-10. PKM2 is therefore a critical determinant of macrophage activation by LPS, promoting the inflammatory response.


Figures

Figure 1
Figure 1. Tetramerization of LPS-induced PKM2 in primary BMDMs inhibits the Hif-1α targets IL-1β and Ldha
LPS-stimulated BMDMs were assayed for expression of PKM2, Y105 phosphorylated PKM2 and β-actin by Western Blotting (A) and Pkm2 mRNA by qRT-PCR (C). (B) Crosslinking (500μM DSS) and western blot of endogenous PKM2 in BMDMs ±LPS (24 hrs). (D) LPS did not significantly affect expression of PKM1 in BMDMs. (E) BMDMs pretreated with ± DASA-58 or ±TEPP-46 as indicated, followed by LPS for 24 hours. Cytosolic and nuclear fractions were isolated and PKM2, β-actin, Lamin A, and Tubulin were detected by western blotting. (F) DSS crosslinking and western blotting of PKM2 in BMDMs and RAW macrophages after treatment ±100μM TEPP-58 or ±50μM DASA-46. (G) RAW macrophages treated with ±10μM TEPP-58 or DMSO (1h), followed by LPS. Protein separated by size exclusion chromatography and blotted for PKM2. (H) BMDMs (left) or PECs (right) were pretreated ±DASA-58 or TEPP-46 (30 min), followed by stimulation with LPS for 24 hours. Cell lysates were analyzed for pro-IL-1β or β-actin expression by western blotting. (I) Il1b (left panel), Il6 (middle panel) and Ldha (right panel) mRNA and (J) IL-6 (left) and TNF (right) protein expression were measured in BMDMs treated with ±DASA-58 and LPS for 6–24 hours. Data represents Mean ± SEM, n=3, **p<0.01.
Figure 2
Figure 2. Activation of PKM2 using TEPP-46 attenuates the M1 attributes of LPS-activated BMDMs
BMDMs were stimulated with 100ng/ml LPS or 20ng/ml IL-4 for M1 and M2 polarization respectively. 24 hours after stimulation RNA was extracted. (A) Left to right, expression of il12-p40, cxcl-10, arginase-1 and mrc-1 were analyzed to assess differentiation into M1 and M2 macrophages. (B) Expression of pkm2 (left) and pkm1 (right) was measured for each polarizing condition. (C) BMDMs were pretreated with 100μM TEPP-46 or DMSO (1hr), followed by LPS (24h). RNA was extracted and expression of il12-p40, cxcl-10, arginase-1 and mrc-1 was analyzed. (D) IL-10 expression measured in supernatants from BMDMs ± DASA-58 (50μM, 30min) followed by LPS (24h). Data represents Mean ± SEM, n=3, **p<0.01. (E) Transcriptomics dataset profile GSE53053 used to identify genes that were significantly up- or down- regulated in M1 or M2 polarizing conditions (Two tail Two sample T-test; nominal p-value <=0.05, Absolute log2-fold-change >= 2-fold). A chi-square test was performed to identify sets of up- or down- regulated genes with significant patterns from microarray data (Figure S1) comparing LPS+DASA-58 to LPS treated macrophages.
Figure 3
Figure 3. Dimeric/monomeric PKM2 is required for LPS-induced binding of PKM2 and Hif-1α to the IL-1β promoter
Immunoprecipitation of PKM2 in BMDMs treated with LPS (24h). Hif-1α measured by immunoblotting (A). (B) BMDMs treated ±TEPP-46 (50μM, 60min) followed by LPS (24h) were lysed and an OPD assay was carried out using oligonucleotide spanning the HIF1α binding site on the IL1β promoter. Samples were probed for Hif-1α (top) and PKM2 (bottom). Representative of n=3. Sequential ChIP–PCR using PKM2 and HIF-1α antibodies and primers specific for −300 position of Il1b in LPS- treated BMDMs (C) and (D) BMDMs treated with TEPP-46/DASA-58 (30 minutes, 50 μM) and LPS (100ng/ml, 24 hrs). ChIP data are calculated as percent of input, represented as fold binding ±SD for one representative experiment (n=3). (E) BMDMs (left panel) or PECs (right panel) (1×10⁶ cells per ml) were pretreated with indicated doses of DASA-58 or TEPP-46 (30 min), followed by LPS (100 ng/ml, 24h). Hif-1α or β-actin expression analyzed by western blotting.
Figure 4
Figure 4. Activation of PKM2 counteracts LPS induced excessive rate of glycolysis and restores cellular levels of succinate
Rate of glycolysis in BMDMs treated ±TEPP-46 (50μM) or DASA-58 (50μM) ±LPS (A). Succinate levels in LPS-treated BMDMs ±DASA-58 (50μM) represented as relative abundance (B). (C) Schematic map illustrating key metabolites and genes that were significantly enhanced (red) or inhibited (blue) in LPS treated (100ng/ml, 24h) BMDMs ± 50μM DASA-58. All metabolites with significant accumulation (p-value < 0.05) are shown in bold red text. Those in yellow suggest up-regulation specific to LPS stimulation. Statistical analysis performed on 3 separate experiments. Metabolites with p value < 0.05 and fold-change > 10% were deemed to be statistically significant.
Figure 5
Figure 5. Inhibition of LPS-induced Hif-1α and Hif-1α target genes in PKM2 depleted BMDMs
BMDMs from mice carrying a PKM2fl/fl allele and relative PKM2+/+ controls were treated ±600 nM Tamoxifen (72h), followed by LPS (24h). Relative mRNA expression levels of Pkm2 (A), Pkm1 (B), Il1b and Ldha (D) were measured by qRT-PCR. PKM2, PKM1, Hif-1α and β-actin protein expression was measured by Western blotting (C). (E) IL-6 and TNFα protein measured by ELISA, depicted as means ± SD of results from triplicate determinations for one representative experiment, n=2. (F) Rate of glycolysis (left) and oxidative phosphorylation (right) in ethanol (PKM2+/+) and Tamoxifen (PKM2−/−) treated LPS-activated BMDMs derived from PKM2fl/fl mice, measured as ECAR and OCR ±SD (n=5). (G) BMDMs derived from PKM2fl/fl mice treated with ethanol (PKM2+/+) or Tamoxifen (PKM2−/−) followed by TEPP-46 or DASA-58 (30 min) and LPS (24h) as indicated. The cells were lysed and expression of il1b mRNA was determined by qRT-PCR.
Figure 6
Figure 6. Activation of PKM2 modulates anti-mycobacterial macrophage responses
Cell lysates from FSL-1 and CpG (24hrs) treated BMDMs were analyzed for PKM2, IL-1β, Hif-1α or β-actin expression by western blotting (A), and pkm2 mRNA by qRT-PCR (B). BMDMs pretreated with TEPP-46 (50μM, 30min) were activated using FSL-1 (100ng/ml) and CpG (1μg/ml) for 24 hours. il1b was analyzed by qRT-PCR (C). Expression levels of IL-1β, Hif-1α, PKM2 and β-actin protein (D), pkm2 mRNA (E), IL-10 (F), TNFα and IL-6 protein (G, left and right) were measured in BMDMs ±TEPP-46 (30 min) stimulated using heat inactivated Mtb. (H) BMDMs ±TEPP-46 (25μM) were infected with live Mtb H37Ra (MOI 5 bacteria/cell, 3hrs) and gene expression of Il1b (left), tnf (middle) and Il10 (right) mRNA analysed (qRT-PCR). Data is mean ± SD for triplicate determinations, n=2. (I) BMDMs ±TEPP-46 (25μM) were infected as above (3 and 72hrs). IL-1β (left), TNFα (middle) and IL-10 (right) production were measured in supernatants of infected cells. BMDMs from (I) were lysed and CFU/ml determined (J). (K) BMDMs derived from wild type or IL-1 Type I Receptor knock out cells were infected as for (H) above. Cells were lysed at 72 hours post-infection and CFU/ml determined. Depicted as means ± SD of results from triplicate wells for one representative experiment n=2. *P<0.05, **P<0.01, ***P<0.001 (two-way analysis of variance with post-hoc Bonferroni correction).
Figure 7
Figure 7. Activation of PKM2 in vivo diminishes the host immune response in LPS-induced sepsis and in an S. typhimurium model of infection
Pro-IL-1β in PECs isolated from mice injected i.p. with TEPP-46 (50mg/kg) or vehicle control (20% 2-Hydroxypropyl-β-cyclodextrin) for 1 hour, followed by PBS or 15mg/kg LPS for 2 hours (A). Left panel shows one representative sample from each treatment group. Right panel represents densitometry readings of pro-IL-1β western blots from 5 mice per group and treatment, normalized to β-actin. Serum levels of IL-1β (B), IL-6 (C) and IL-10 (D) from mice in (A). n=5 for each group, mean±SEM, **p<0.01. (E) BMDMs were treated ±TEPP-46 (30 min, 25 μM), prior to infection with S. typhimurium UK-1 strain at an MOI of 10 bacteria/cell. Bacterial numbers were assessed at 4h p.i. CFU/ml enumerated 4h after plating. Mice were injected ±TEPP-46 (50mg/kg), 1 hr prior to infection with S. typhimurium (1×10⁶ CFU, 2h). Pro-IL-1β from PECs was measured by western blotting (F), and serum levels of IL-6, IL-10 and IL-18 were measured by ELISA (G). (H) Mice were infected as (F), and sacrificed 24h post infection. Livers and spleens were extracted and Log CFU/organ was determined (n=5 per group, mean ±SEM, two tailed t-test ).

References

    1. Altenberg B, Greulich KO. Genes of glycolysis are ubiquitously overexpressed in 24 cancer classes. Genomics. 2004;84:1014–1020. - PubMed
    1. Anastasiou D, Yu Y, Israelsen WJ, Jiang JK, Boxer MB, Hong BS, Tempel W, Dimov S, Shen M, Jha A, et al. Pyruvate kinase M2 activators promote tetramer formation and suppress tumorigenesis. Nature chemical biology. 2012;8:839–847. - PMC - PubMed
    1. Ashizawa K, Willingham MC, Liang CM, Cheng SY. In vivo regulation of monomer-tetramer conversion of pyruvate kinase subtype M2 by glucose is mediated via fructose 1,6-bisphosphate. The Journal of biological chemistry. 1991;266:16842–16846. - PubMed
    1. Bafica A, Scanga CA, Feng CG, Leifer C, Cheever A, Sher A. TLR9 regulates Th1 responses and cooperates with TLR2 in mediating optimal resistance to Mycobacterium tuberculosis. The Journal of experimental medicine. 2005;202:1715–1724. - PMC - PubMed
    1. Boxer MB, Jiang JK, Vander Heiden MG, Shen M, Skoumbourdis AP, Southall N, Veith H, Leister W, Austin CP, Park HW, et al. Evaluation of substituted N,N′-diarylsulfonamides as activators of the tumor cell specific M2 isoform of pyruvate kinase. Journal of medicinal chemistry. 2010;53:1048–1055. - PMC - PubMed

Publication types

MeSH terms