. 2015 Jan 1;6(1):409-26.
doi: 10.18632/oncotarget.2774.

Irinotecan treatment and senescence failure promote the emergence of more transformed and invasive cells that depend on anti-apoptotic Mcl-1

Affiliations

Irinotecan treatment and senescence failure promote the emergence of more transformed and invasive cells that depend on anti-apoptotic Mcl-1

Barbara Jonchère et al. Oncotarget. .

Abstract

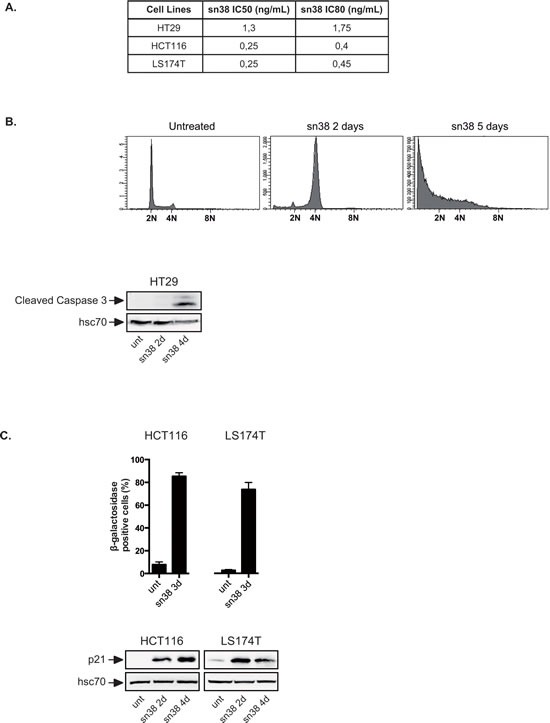
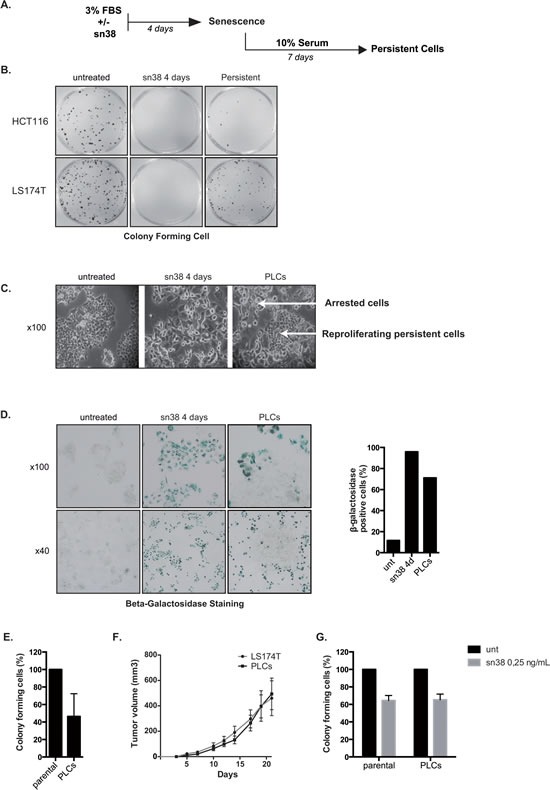
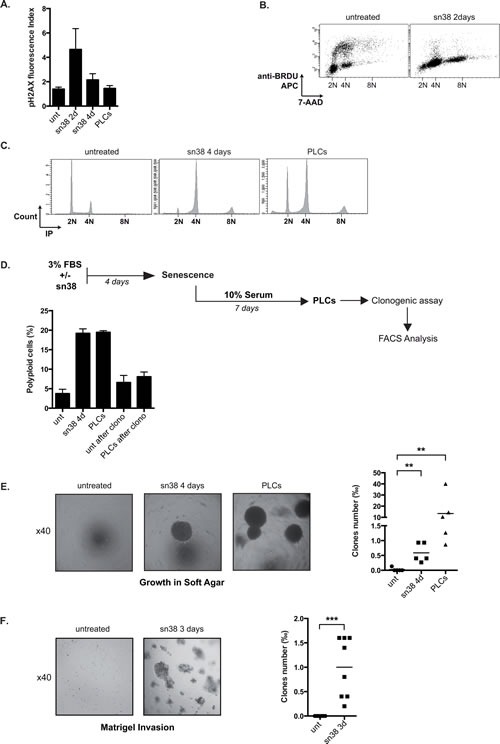
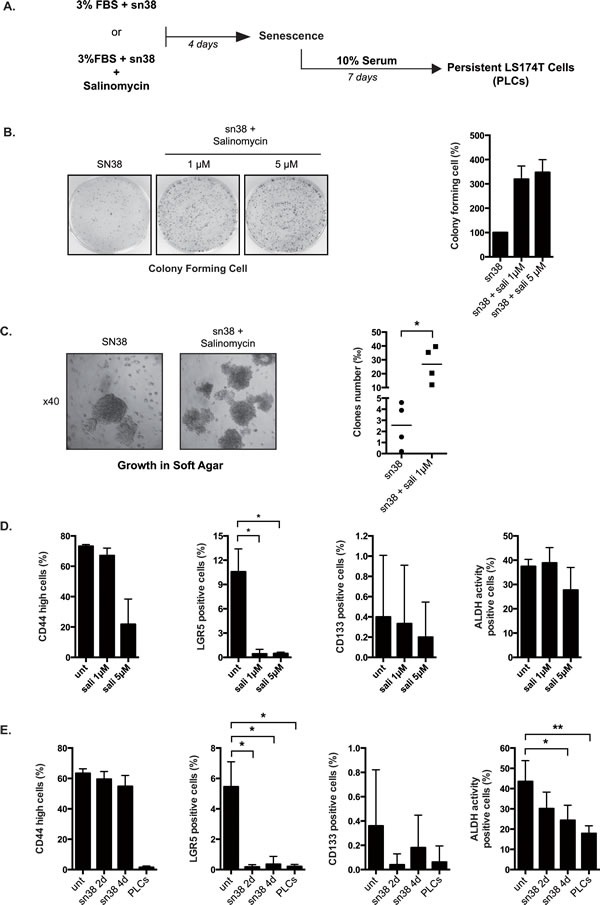
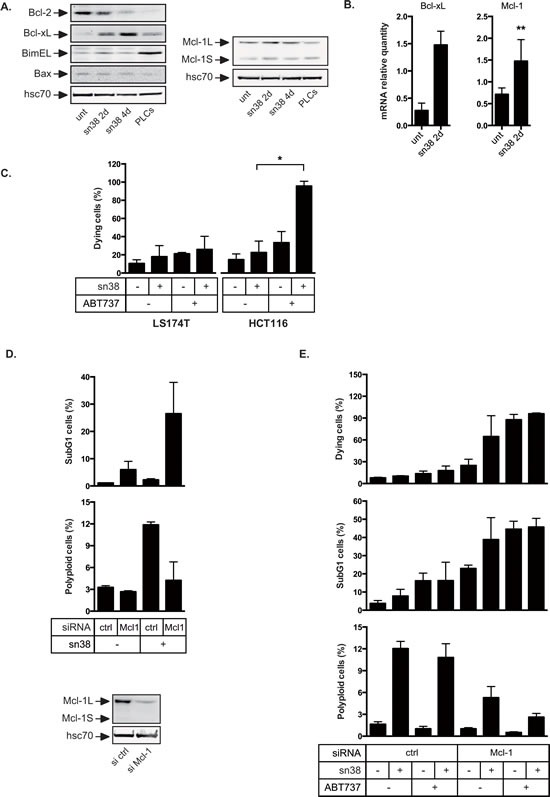
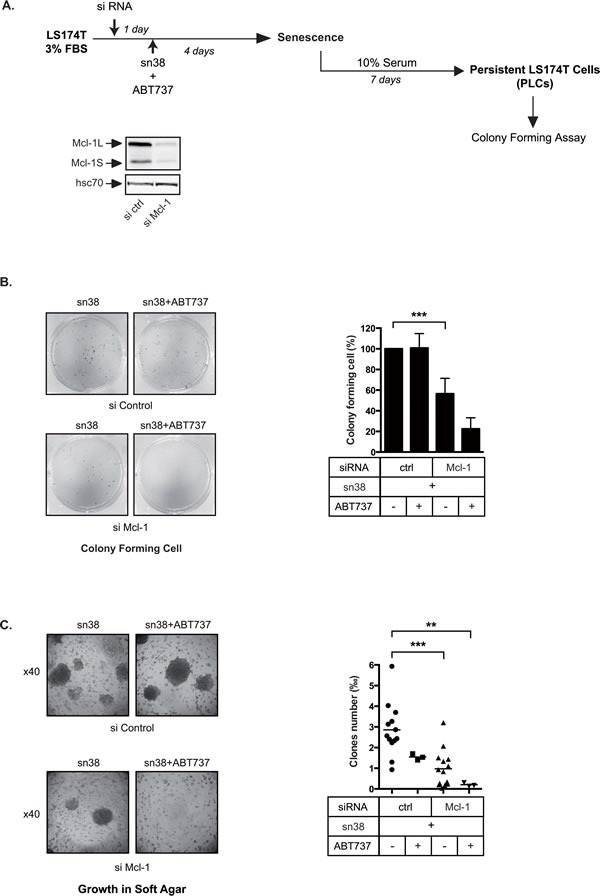
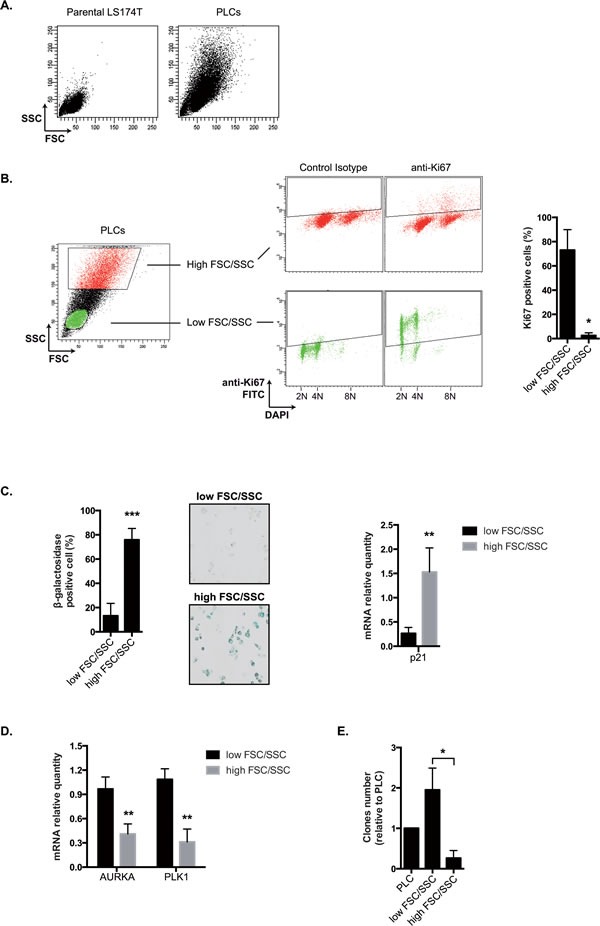
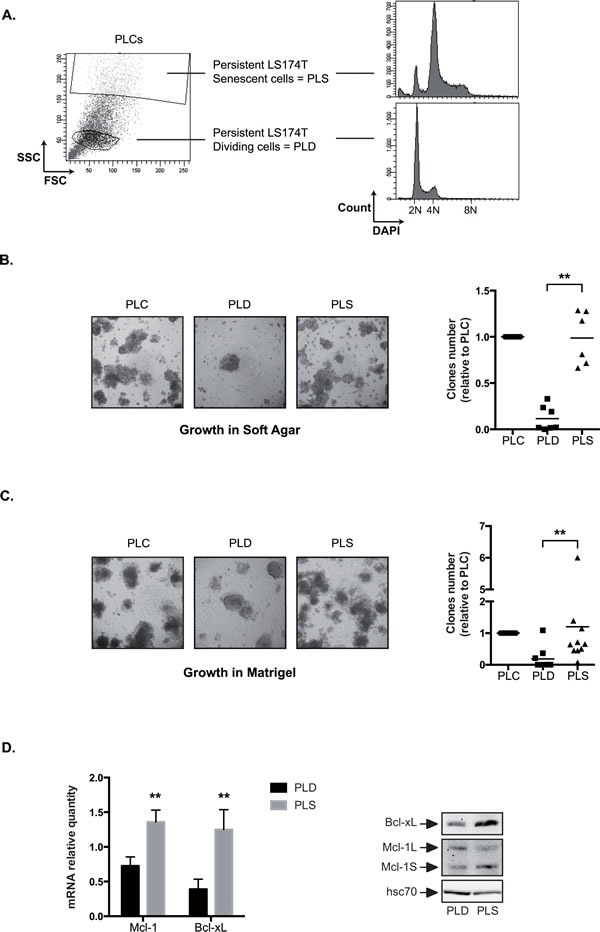
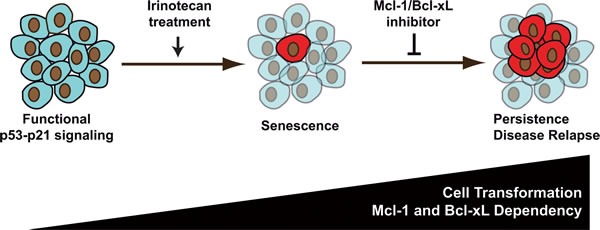
Induction of senescence by chemotherapy was initially characterized as a suppressive response that prevents tumor cell proliferation. However, in response to treatment, it is not really known how cells can survive senescence and how irreversible this pathway is. In this study, we analyzed cell escape in response to irinotecan, a first line treatment used in colorectal cancer that induced senescence. We detected subpopulations of cells that adapted to chemotherapy and resumed proliferation. Survival led to the emergence of more transformed cells that induced tumor formation in mice and grew in low adhesion conditions. A significant amount of viable polyploid cells was also generated following irinotecan failure. Markers such as lgr5, CD44, CD133 and ALDH were downregulated in persistent clones, indicating that survival was not associated with an increase in cancer initiating cells. Importantly, malignant cells which resisted senescence relied on survival pathways induced by Mcl-1 signaling and to a lesser extent by Bcl-xL. Depletion of Mcl-1 increased irinotecan efficiency, induced the death of polyploid cells, prevented cell emergence and inhibited growth in low-adhesion conditions. We therefore propose that Mcl-1 targeting should be considered in the future to reduce senescence escape and to improve the treatment of irinotecan-refractory colorectal cancers.


Figures

Figure 1
Figure 1. Topoisomerase I inhibition leads to apoptosis or senescence
A. Clonogenic assays of colorectal HT29, HCT116 and LS174T cells. Cells have been treated with different doses of sn38 for 7 to 10 days and colony formation was then counted using crystal violet coloration. For each cell line, the growth of non treated cells was set up at 100% and IC50 and IC80 doses were determined (n=3). B. HT29 cells have been stimulated or not with sn38 (5ng/ml) for the indicated times and flow cytometry experiments were performed to quantify the number of subG1 cells using DAPI staining. In parallel, total cell extracts were recovered and caspase 3 activation was evaluated by western blot analysis (n=2). C. HCT116 and LS174T have been stimulated or not by sn38 (5ng/ml) as indicated. The percentage of senescent cells was evaluated as the number of cells expressing SA-ßgal activity (n=3 +/− sd) and evidenced by the expression of p21waf1 by western blot.
Figure 2
Figure 2. Cell emergence following sn38 treatment
A. Experimental procedure to generate persistent cells. Cells have been treated or not with sn38 (5ng/ml) in 3% FBS for 4 days and then further stimulated with 10% FBS for 7 days to reinduce cell growth in the absence of drug. To measure cell proliferation, clonogenic assays were then performed using either untreated cells, cells treated for 4 days or persistent cells. B. Representative images of the proliferation capacity of the different cells. Untreated cells, cells treated for 4 days with sn38 and persistent cells were recovered and analyzed using clonogenic assays (representative image of three experiments). C. Representative images of PLCs heterogeneity. Note the emergence of islets of proliferating cells in PLCs (KI67 staining is presented Figure 7, representative image of four experiments). D. Representative images of cells expressing SA-ßgal activity in untreated cells, after 4 days of treatment or in PLCs. Quantification of one representative experiment is shown on the right. E. The proliferative capacity of parental LS174T cells and PLCs was quantified by clonogenic test (n=3+/−sd). F. In vivo evaluation of tumor formation by parental LS174T cells or PLCs. Cells were injected subcutaneously in immunocompromised mice and the tumor volume was monitored during twenty days ( 6 mice were used per condition in each experiment). G. sn38 sensibility of parental LS174T cells and of PLCs was evaluated by clonogenic assays using IC50 concentration (n=3+/−sd).
Figure 3
Figure 3. PLCs are more transformed as compared to parental cells
A. DNA damage has been evaluated following treatment and in PLCs by FACS analysis using an antibody directed against the serine 139 phosphorylated form of H2Ax, the mean of fluorescence is presented (n=4 +/−sd). B. LS174T cells have been treated or not with sn38 (5ng/ml) for 48 hrs in the presence of BrdU. Cells were then analyzed for cell cycle distribution by flow cytometry using BrdU labeling and 7AAD staining (representative image of three experiments). C. Vindelov 83 coloration by flow cytometry has been performed to analyze cell cycle profiles and polyploidy in the different conditions (one image is shown, representative of three different experiments). D. Analysis of the proliferative capacity of polyploid cells. LS174T cells treated with sn38 (5ng/ml) for 4 days were further stimulated with 10% FBS for 7 days to reinduce cell growth and generate polyploid cells. Cells were then trypsinized, replated in 10% FBS and allowed to form colonies for 7-10 days. The presence of polyploid cells was then analyzed by flow cytometry, using either parental cells (unt. after clono.) or PLCs for this procedure (PLCs after clono. n=3+/−sd). E and F. Growth of the PLCs was evaluated in soft agar (E) or in matrigel (F), note that 5000 cells were used for these experiments. Representative images are shown (x40) and the number of clones growing in low adhesion has been quantified after 10-20 days (n=5 for soft agar and 8 for matrigel).
Figure 4
Figure 4. Salinomycin enhances emergence and growth in soft agar
A. Cells have been treated or not with sn38 (5ng/ml) for 4 days in the presence or absence of salinomycin (1 and 5μM). Cells were then further stimulated with 10% FBS for 7 days to reinduce cell growth. B. Cells have been treated with sn38 in the presence or absence of salinomycin and the proliferative capacity of PLCs was evaluated by clonogenic tests. Representative images are shown on the left and the quantification of clonogenic results is presented on the right of the figure. Salinomycin was used at 1μM (n=3+/−sd) or 5 μM (n=2 +/− sd). C. LS174T cells have been treated or not with sn38 and salinomycin (1μM) for 3 days. Growth in soft agar was evaluated for 10-20 days. 5000 cells were used in each experiment. Representative images are shown (x40) and the number of clones growing in low adhesion was quantified (n=4). D. CD44high, lgr5, CD133 expressions and Aldh activity have been analysed by flow cytometry following salinomycin treatment of parental LS174T cells for 4 days in 10% FBS. Percentage of positive cells are presented (n=3 +/−sd). E. FACS analysis was performed in cells treated or not with sn38 or in PLCs as indicated (n=3 +/−sd).
Figure 5
Figure 5. Overexpression of Bcl-xL and Mcl-1 in response to sn38
A. Bcl-xL, Bcl2, Mcl-1, Bim, Bax, and hsc70 expressions have been evaluated by western blot analysis using total cell extracts, following sn38 treatment or in PLCs (n=3). B. The mRNA expressions of Bcl-xL and Mcl-1 have been evaluated by quantitative RT-PCR (n=3 for Bcl-xL and n=5 for Mcl-1). C. LS174T or HCT116 cells have been treated or not by sn38 for 3 days followed by the addition of ABT737 as indicated for 1 day. Cell death was then analyzed by trypan blue exclusion. Note that the early death to sn38 is evaluated here as opposed to long term clonogenic assays shown in Figures 1 and 2 (n=3 +/− sd). D. Mcl-1 expression was down-regulated by RNA interference and 1 day after LS174T cells have been treated with sn38 for 2 days. Cell death was evaluated by flow cytometry analysis through the evaluation of subG1 cells (n=3 +/−sd). In parallel, the percentage of polyploid (>4n) cells has been analyzed (n=3 +/−sd). Mcl-1 down-regulation is shown on the bottom part of the figure. E. Mcl-1 has been down-regulated as described above for 1 day, cells were treated with sn38 for 3 days followed by the addition or not of ABT737 during 1 day. Cell death was evaluated by trypan blue exclusion or subG1 analysis by flow cytometry (n=3 +/−sd). In parallel, the percentage of polyploid cells has been analyzed (n=3 +/−sd ).
Figure 6
Figure 6. Persistent cells depend on Mcl-1
A. Experimental procedure to inactivate pro-survival proteins during the generation of persistent cells. Mcl-1 expression was down-regulated by RNA interference, 1 day after LS174T cells were treated with sn38 and, where indicated, with ABT737 for 4 days. Emergence and growth in low adhesion were then evaluated. B. Following Mcl-1 inactivation and ABT737 addition as indicated, the proliferative capacity of PLCs was evaluated by clonogenic tests (n=3). Representative images are shown on the left of the figure, and the quantification of clonogenic results are presented on the right (n=3 +/− sd). C. Following Mcl-1 inactivation and ABT737 addition as indicated, treated-cells were recovered after 4 days and grown in soft agar. Representative images are shown on the left of the figure (x40), and quantification results are presented on the right.
Figure 7
Figure 7. PLCs as an heterogeneous mixture of PLS and PLD cells
A. SSC and FSC parameters have been evaluated by flow cytometry in parental LS174T cells and PLCs (one image representative of 6 experiments). B. Proliferation has been evaluated by flow cytometry using an antibody directed against the KI67 antigen. Following DNA DAPI staining, cells have been gated according to low or high FSC/SSC values and the corresponding KI67 expression has been evaluated. Percentages of positive cells are presented on the right part of the figure (n=4+/−sd). C. Cells have been cell sorted by flow cytometry according to low and high FSC/SSC parameters and the percentage of SA-ßgal positive cells has been evaluated in each subpopulation (n=8+/−sd). Representative images are shown on the middle part of the figure (x100). p21waf1 mRNA expression has been evaluated by quantitative RT-PCR in each subpopulation (n=5+/−sd). D. Cells have been cell sorted by flow cytometry according to low and high FSC/SSC parameters. Aurora-A and PLK-1 mRNA expressions in each subpopulation have been evaluated by quantitative RT-PCR (n=5+/−sd). E. Cells have been cell sorted by flow cytometry according to low and high FSC/SSC parameters. The proliferative capacity of the two subpopulations and of PLCs was quantified by clonogenic test (n=4+/−sd).
Figure 8
Figure 8. PLS cells grow in low adhesion conditions
A. Following cells sorting and DAPI DNA staining after 3 days of culture, DNA content has been analyzed in PLD (enriched dividing cells = low FSC/SSC) and PLS (enriched senescent cells = high FSC/SSC) by flow cytometry (n=3, one representative image is shown). B and C. Growth of the PLD and PLS was evaluated in soft agar (B) or in matrigel (C). 10 000 cells were used in each experiment. Representative images are shown (x40) and the number of clones growing in low adhesion was quantified after 10-20 days (n=6 for soft agar and n=9 for matrigel). D. The mRNA and protein expressions of Mcl-1 and Bcl-xL have been evaluated by quantitative RT-PCR (n=5 +/− sd) and by western blot analysis (n=4) using total cell extracts of PLD or PLS cells as indicated.
Figure 9
Figure 9. sn38 survival is associated with increased cell transformation and dependency on Mcl-1: an opportunity for new treatments in colorectal cancer
In response to sn38, a small fraction of cells escapes the senescence suppressive arrest and emerges as an heterogeneous and more transformed population. We speculate that these cells are responsible of treatment failure and disease relapse. Since surviving cells depend on Mcl-1 signaling (and to a lesser extent on Bcl-xL), we propose that inhibitors of the Bcl2 family should be used to improve irinotecan efficiency in the treatment of colorectal cancers.

Comment in

  • Mcl-1 and tumor cell persistence.
    Pfannenstiel LW, Gastman BR. Pfannenstiel LW, et al. Oncotarget. 2015 Jan 1;6(1):5-6. doi: 10.18632/oncotarget.3035. Oncotarget. 2015. PMID: 25575820 Free PMC article. No abstract available.
  • Senescence versus apoptosis in chemotherapy.
    Ansieau S, Collin G. Ansieau S, et al. Oncotarget. 2015 Mar 10;6(7):4551-2. doi: 10.18632/oncotarget.3114. Oncotarget. 2015. PMID: 25732846 Free PMC article. No abstract available.

References

    1. Kuilman T, Michaloglou C, Mooi WJ, Peeper DS. The essence of senescence. Genes Dev. 2010;24(22):2463–2479. - PMC - PubMed
    1. Narita M, Nunez S, Heard E, Narita M, Lin AW, Hearn SA, Spector DL, Hannon GJ, Lowe SW. Rb-mediated heterochromatin formation and silencing of E2F target genes during cellular senescence. Cell. 2003;113(6):703–716. - PubMed
    1. Roninson IB. Tumor cell senescence in cancer treatment. Cancer Res. 2003;63(11):2705–2715. - PubMed
    1. Schmitt CA, Fridman JS, Yang M, Lee S, Baranov E, Hoffman RM, Lowe SW. A senescence program controlled by p53 and p16INK4a contributes to the outcome of cancer therapy. Cell. 2002;109(3):335–346. - PubMed
    1. Singh A, Settleman J. EMT, cancer stem cells and drug resistance: an emerging axis of evil in the war on cancer. Oncogene. 2010;29(34):4741–4751. - PMC - PubMed

Publication types

MeSH terms