. 2014 Dec 11:8:424.
doi: 10.3389/fncel.2014.00424. eCollection 2014.

The heterogeneity in GABAA receptor-mediated IPSC kinetics reflects heterogeneity of subunit composition among inhibitory and excitatory interneurons in spinal lamina II

Affiliations

The heterogeneity in GABAA receptor-mediated IPSC kinetics reflects heterogeneity of subunit composition among inhibitory and excitatory interneurons in spinal lamina II

Charalampos Labrakakis et al. Front Cell Neurosci. .

Abstract

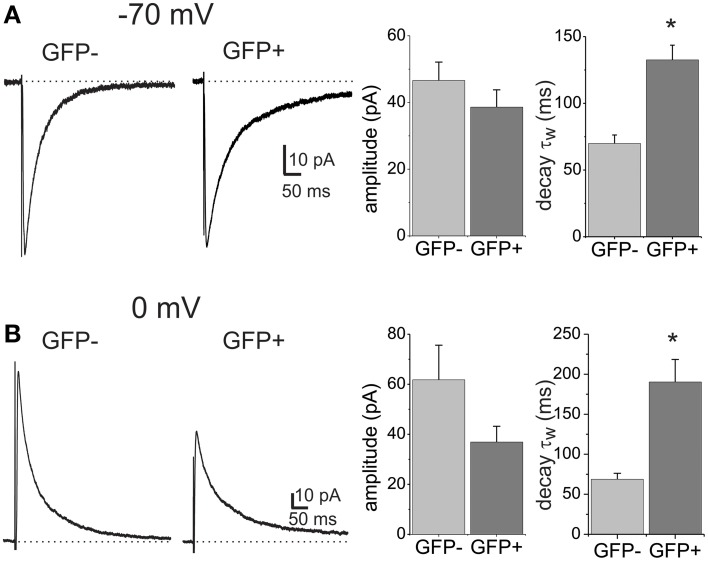
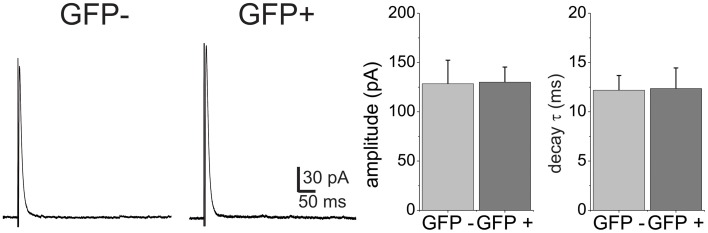
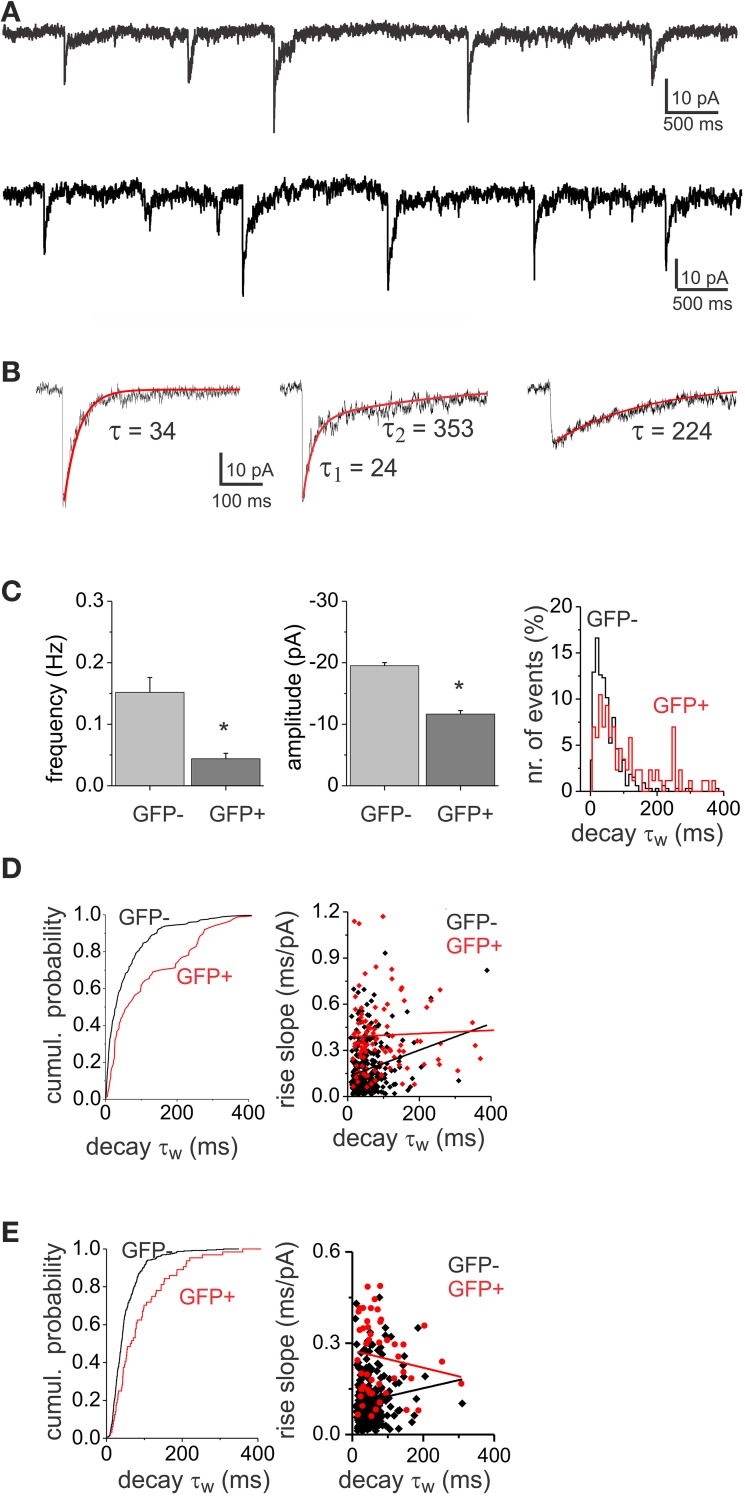
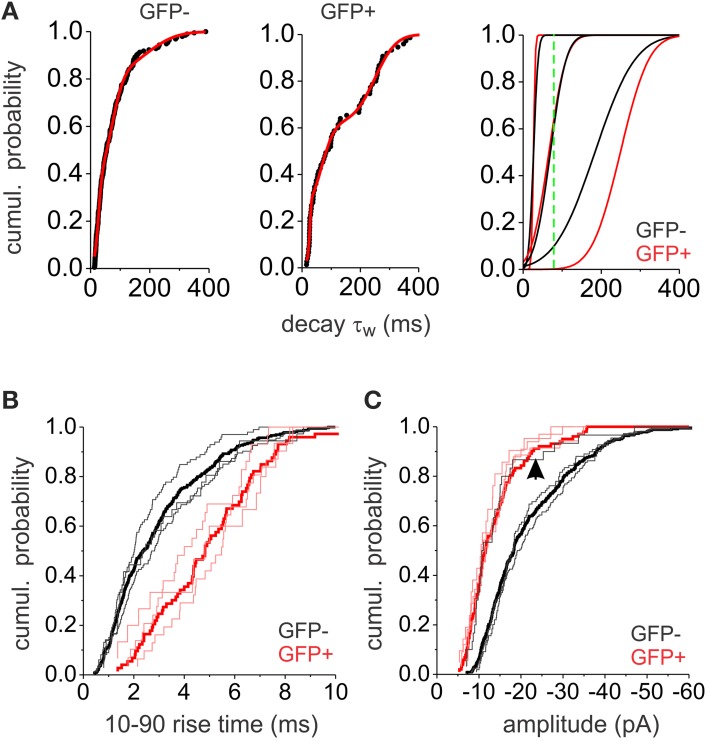
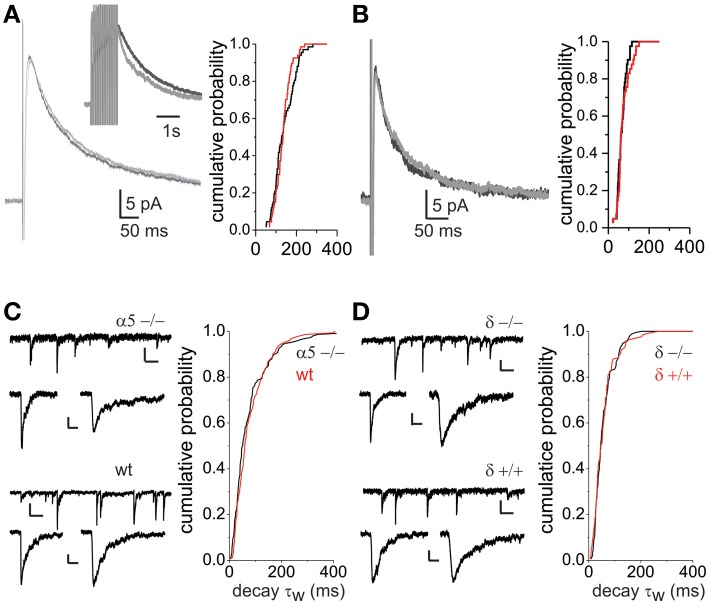
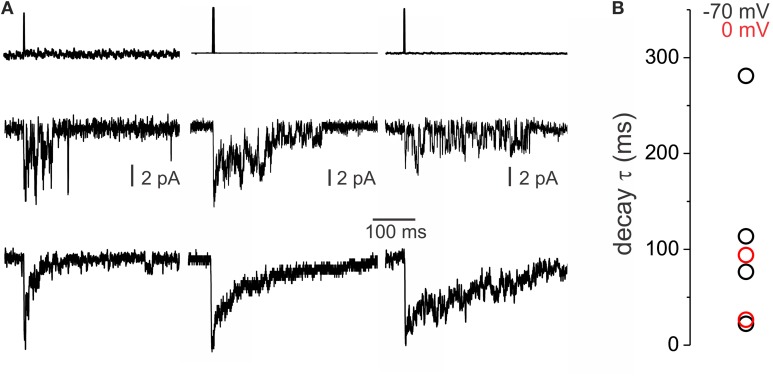
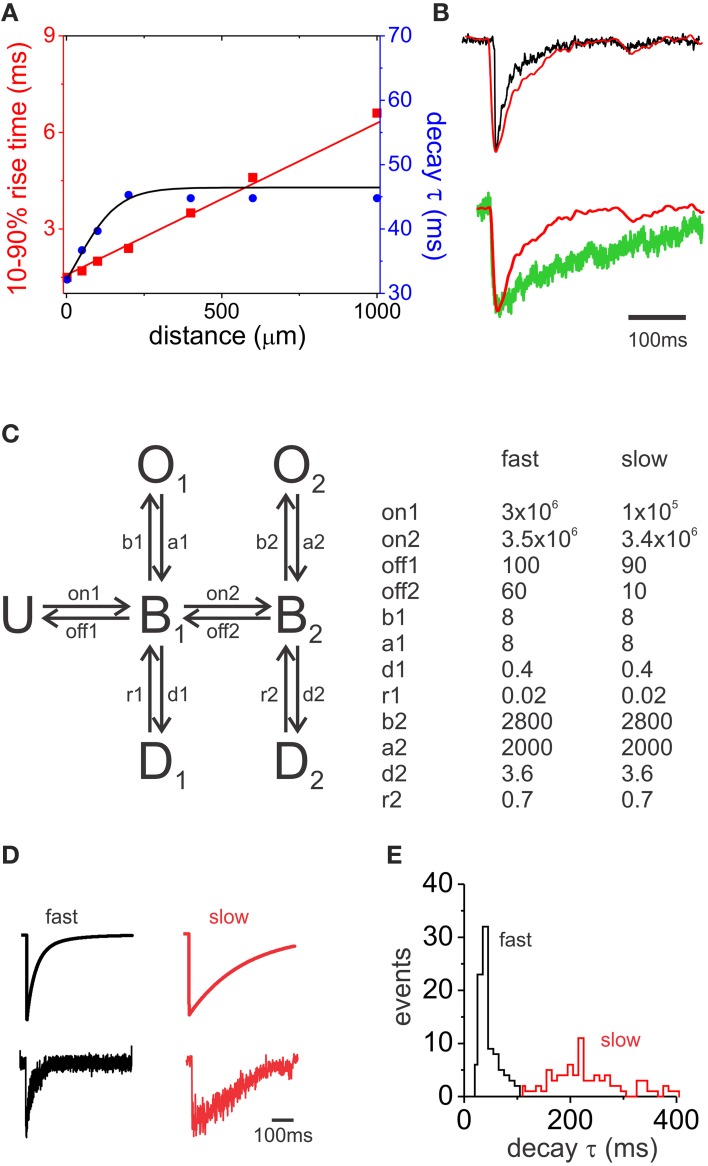
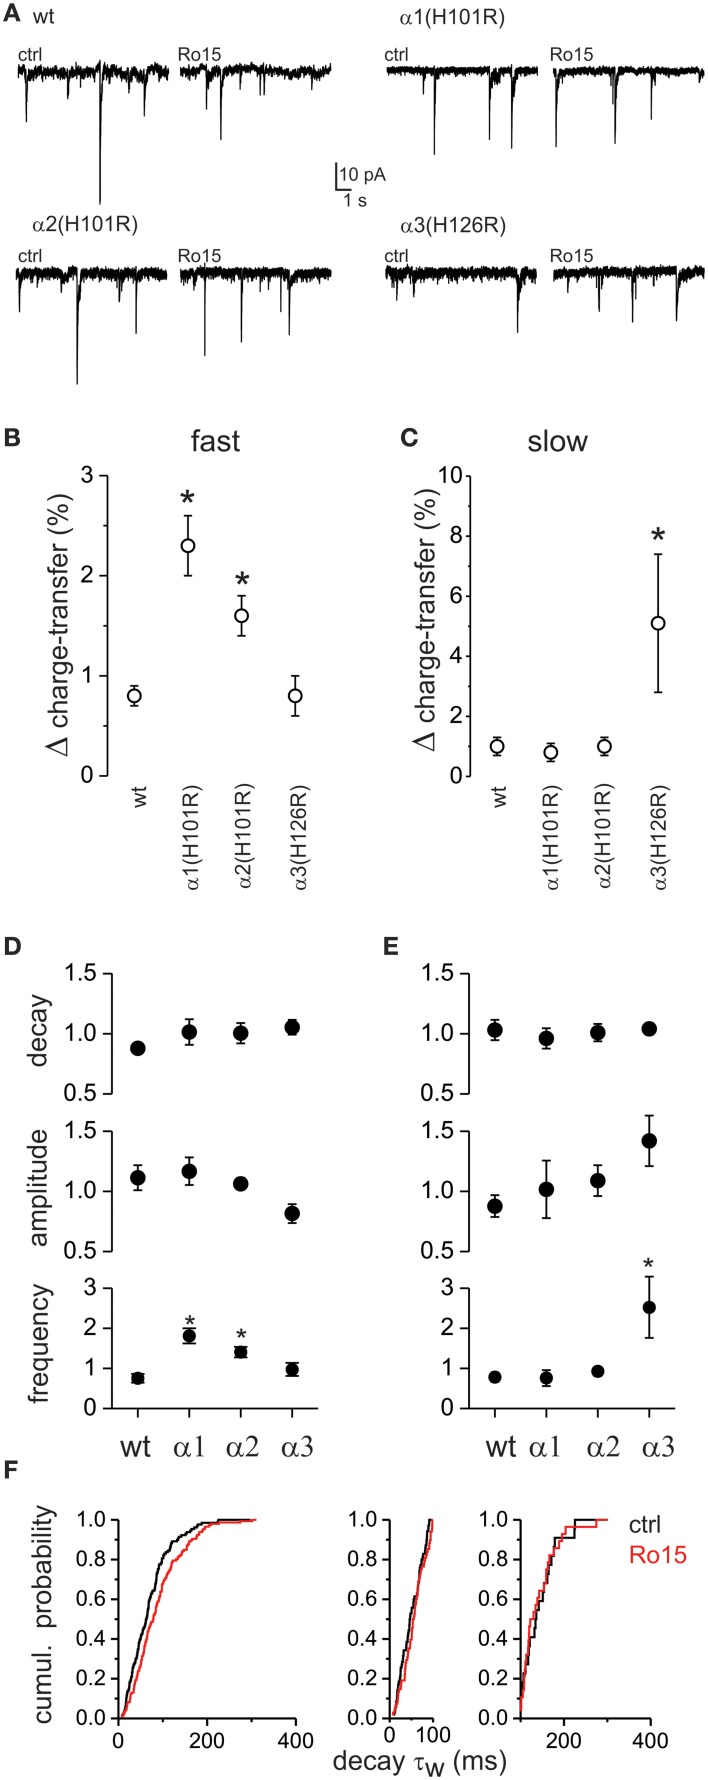
GABAergic inhibition displays rich functional diversity throughout the CNS, which arises from variations in the nature of inputs, subunit composition, subcellular localization of receptors and synapse geometry, or reuptake mechanisms. In the spinal dorsal horn (SDH), GABAA and glycine receptors play a major role in the control of excitability and accuracy of nociceptive processing. Identifying which components shape the properties of the inhibitory synapses in different cell types is necessary to understand how nociceptive information is integrated. To address this, we used transgenic mice where inhibitory interneurons express GAD65-EGFP. We found that GABAA, but not glycine receptor-mediated evoked IPSCs displayed slower kinetics in EGFP+ vs. EGFP- interneurons. GABAA miniature IPSC decay kinetics showed a large variability in both populations, however the distribution of decays differed between EGFP+ and EGFP- interneurons. The range of mIPSC decay kinetics observed was replicated in experiments using rapid application of GABA on outside-out patches taken from SDH neurons in slices. Furthermore, GABAA decay kinetics were not affected by uptake blockers and were not different in mice lacking δ or α5 subunits, indicating that intrinsic channel properties likely underlie the heterogeneity. To identify whether other α subunits shape the various kinetic properties observed we took advantage of knock-in mice carrying point mutations in either the α1, α2, or α3 subunits rendering Ro 15-4513 a selective agonist at the benzodiazepine modulatory site. We found that α1 and α2 subunit underlie the fast decaying component of IPSCs while the slow component is determined by the α3 subunit. The differential distribution of GABAA subunits at inhibitory synapses thus sculpts the heterogeneity of the SDH inhibitory circuitry. This diversity of inhibitory elements can be harnessed to selectively modulate different components of the spinal nociceptive circuitry for therapeutic interventions.

Keywords: GABAA receptors; IPSCs; decay kinetics; spinal dorsal horn; subunit composition.


Figures

Figure 1
Figure 1
GABAA receptor-mediated eIPSCs differ in their decay kinetics between lamina II dorsal horn neuron subpopulations. (A) IPSCs evoked by focal stimulation recorded from a EGFP negative (GFP−) and a EGFP positive (GFP+) neuron. Recordings were made at a −70 mV holding potential with CsCl containing pipettes. Histograms show the mean amplitude and weighted decay time constant (τw) in the two cell populations. The asterisk denotes significant difference (n = 21 for GFP− and n = 28 for GFP+). (B) Example traces of eIPSCs recorded from GFP− and GFP+ cells at a holding potential of 0 mV and using CsSO3CH3-containing patch pipettes. Histograms show the mean amplitude and decay τw. Asterisk denotes significant difference (n = 12 for GFP− and n = 14 for GFP+).
Figure 2
Figure 2
Glycine receptor-mediated eIPSCs have similar decay kinetics in GFP+ and GFP− neurons. Example traces of eIPSCs were recorded from GFP− and GFP+ neurons at a holding of 0 mV. Neither amplitude nor decay time constant were significantly different in the two populations (n = 6 for GFP− and n = 6 for GFP+).
Figure 3
Figure 3
GABAA mIPSCs show both fast- and slow-decay kinetics. (A) Example of a recording of mIPSCs from a GFP+ (top) and a GFP− (bottom) neuron displaying variable decay kinetics. (B) Different examples of single mIPSCs with variable decay kinetics: fast (left), mixed (middle) and slow decay (right) events. (C) Histograms of mIPSC frequency and amplitude showing significant differences (asterisk) between GFP− (n = 6) and GFP+ (n = 6) cell populations. The population distribution histogram of decay time constants (left, bin width: 20 ms) shows that GFP− and GFP+ display different proportions of fast and slow mIPSCs. (D) The cumulative probability plot (left) shows differential distribution of mIPSC decay τw between GFP− and GFP+ cell populations (left, p < 0.05 Kolmorgorov-Smirnov test). The plot consists of pooled mIPSC decay time constants from 6 GFP− and 6 GFP+ cells. The same number of consecutively occurring mIPSCs from each cell was used. The relationship between 10 and 90% rise slope and the decay τw in EGFP− and EGFP+ mIPSCs is plotted on the right. There was no correlation between mIPSC rise and decay neither in GFP− (r = 0.22) nor in GFP+ (r = 0.05) neurons. (E) Cumulative probability plot (left) and rise-slope/decay τw relationship plot (right) of the subset of data with rise times <4 ms. The distribution of decay τw between GFP− and GFP+ cells was different (p < 0.05), while there was no correlation between rise time and decay τw in GFP− (r = 0.11) and GFP+ (r = 0.14) neurons.
Figure 4
Figure 4
Analysis of mIPSC populations. (A) The cumulative probability plots for GFP− and GFP+ neurons (left and middle) were fitted with the sum of three normal distribution functions (red line). The resulting three distributions are plotted (right) separately (black lines for GFP−, red lines for GFP+. The green line is showing the 100 ms cut-off point used to separate slower from faster events). (B) Cumulative probability plots of the 10–90% rise times for GFP− (black) and GFP+ (red) mIPSCs. Thick lines show the total mIPSC population while the thin lines show subpopulations of mIPSCs based on the three Gaussian distributions distinguished in (A). (C) Cumulative probability plots of the mIPSC amplitudes in GFP− (black) and GFP+ (red) interneurons. Thick lines show the total mIPSC population while the thin lines show subpopulations of mIPSCs based on the three Gaussian distributions distinguished in (A). The arrow denotes the cumulative distribution of the amplitudes in the slow decaying subpopulation of GFP− interneurons. All plots consist of pooled data from 6 GFP+ and 6 GFP− neurons. The same number of consecutively occurring mIPSCs from each cell was used.
Figure 5
Figure 5
Slow GABAA IPSC decay kinetics in lamina II dorsal horn neurons are not explained by spillover or extrasynaptic receptor activation. (A) Application of the GABA uptake blocker SKF89976A (SKF) does not affect the decay time of single GABAA eIPSCs in GFP+ neurons. Traces on the left show average eIPSCs (0 mV holding potential) before (light gray) and during SKF application (black) recorded from a GFP+ neuron. On the right, the cumulative probability plots of eIPSC decay τw's from 5 GFP+ cells are shown (p > 0.05). The inset illustrates IPSCs evoked by a train of 12 stimuli at 20 Hz in the same cell (as in left) and shows a prolonged response after SKF application, indicating that block of uptake, in this case, revealed accumulation of GABA (the traces shown are normalized to the peak value). SKF prolonged the IPSC decay half-width after a train stimulus from 0.54 ± 0.08 to 0.65 ± 0.07 s (n = 5 GFP+ cells, p < 0.05). (B) Application of SKF does not affect the decay time of GABAA eIPSCs in GFP− neurons. Traces on the left show average eIPSCs before (light gray) and during SKF application (black) recorded from a GFP− neuron. On the right, the cumulative probability plots of eIPSC decay τw's from 4 GFP− cells are shown (p > 0.05). (C) Traces of mIPSC recordings (scale bars: 10 pA, 0.5 s) and examples of single mIPSCs (scale bars: 10 pA, 50 ms) recorded from α5−/− (upper) and wild type (lower) mice. The cumulative probability plot shows identical distribution of decay τw between knock-out (6 cells) and control mice (6 cells). (D) Traces of mIPSC recordings (scale bars: 10 pA, 0.5 s) and examples of single mIPSCs (scale bars: 10 pA, 50 ms) recorded from δ −/− (upper) and δ +/+ (lower) mice. The distribution of decay time constants is similar in δ −/− (6 cells) and δ+/+ (5 cells) as shown by the cumulative probability plot.
Figure 6
Figure 6
Heterogeneity of decay kinetics of transient GABAA currents in outside-out patches. (A) Current traces showing responses to rapid application (1 ms pulse) of 1 mM GABA of varying decay times in different membrane patches. On top, the average of the liquid junction current recording is shown. In the middle, traces from a single application are shown. Average traces of multiple applications on the same membrane patches are shown at the bottom. (B) Graph showing the decay τ of individual excised patches. In black are shown outside-out patches recorded with high Cl− pipette solution and a holding of −70 mV while in red are recordings from excised patches made with low Cl− pipettes at 0 mV holding potential.
Figure 7
Figure 7
Simulation of mIPSC decay kinetics. (A) The graph illustrates the changes in 10–90% rise time and decay τ in relation to the distance of the synapse from the soma in a model cell. A recorded fast mIPSC was used as a synaptic conductance. (B) Top, superimposed synaptic currents measured at the soma for synapses located at 0 μm (black) and 1000 μm (red) away from the soma. Traces were aligned at the peak. Bottom, superimposed traces from a synaptic current originating 1000 μm away from the soma of the model cell (red) and a slow decaying recorded mIPSC (green). (C) Schematic representation of the six-state Markov model of GABA receptor activation used (left). U, unbound; B, bound; O, open,; and D, desensitized states. A list of rate constants used to simulate fast and slow decay GABA currents is shown on the right. on1 and on2 binding rate constants are in M−1s−1 and the rest rate constant in s−1. (D) Top, computationally generated macroscopic current simulations for fast and slow decay parameters. Bottom, examples of simulated GABAA mIPSCs resulting from the summation of stochastic opening of 20 single channels. (E) Population histogram showing the distribution of decay τ for fast (black) and slow (red) simulated mIPSCs.
Figure 8
Figure 8
Differential role of α-subunits in shaping GABAA IPSC decay kinetics. Effect of the partial benzodiazepine inverse agonist Ro15-4513 on fast and slow mIPSCs in control (wt), α1(H101R), α2(H101R), and α3(H126R) knock-in mice. (A) Example traces of mIPSC recordings before (ctrl) and during Ro 15-4513 in the different mouse lines. (B) The relative change in total mIPSC charge transfer (Δ charge-transfer) mediated by fast decay mIPSCs after the application of Ro15-4513. (C) The relative change in the Δ charge-transfer mediated by slow decay mIPSCs after the application of Ro15-4513. (D) The relative changes in mIPSC decay τ, amplitude and frequency for fast decaying mIPSCs after the application of Ro15-4513. (E) The relative changes in mIPSC decay τ, amplitude and frequency for slow decaying mIPSCs after the application of Ro15-4513. Asterisks denote significant difference between cells taken from wild type and knock-in mice (ANOVA with post-hoc Tukey test, p < 0.05, n = 9, 6, 6, and 6 respectively). (F) The cumulative probability plot of mIPSC decay τw for α3(H126R) knock-in mice (left) is shown before (ctrl) and during Ro 15-4513. Application of Ro 15-4513, shifted the decay τ distribution to the right, as expected by the increase in frequency of the slowly decaying mIPSCs subpopulation. Indeed, the cumulative probability plots for the fast (middle) and slow (right) subpopulations of the α3(H126R) mIPSC decay τw show no differences between ctrl and Ro15 in their distribution. All plots consist of pooled data from six α3(H126R) neurons. The same number of consecutively occurring mIPSCs from each cell was used.

References

    1. Baba H., Ji R. R., Kohno T., Moore K. A., Ataka T., Wakai A., et al. (2003). Removal of GABAergic inhibition facilitates polysynaptic A fiber-mediated excitatory transmission to the superficial spinal dorsal horn. Mol. Cell Neurosci. 24, 818–830. 10.1016/S1044-7431(03)00236-7 - DOI - PubMed
    1. Bacci A., Rudolph U., Huguenard J. R., Prince D. A. (2003). Major differences in inhibitory synaptic transmission onto two neocortical interneuron subclasses. J. Neurosci. 23, 9664–9674. - PMC - PubMed
    1. Benson J. A., Low K., Keist R., Mohler H., Rudolph U. (1998). Pharmacology of recombinant gamma-aminobutyric acida receptors rendered diazepam-insensitive by point-mutated alpha-subunits. Febs. Lett. 431, 400–404. 10.1016/S0014-5793(98)00803-5 - DOI - PubMed
    1. Bohlhalter S., Weinmann O., Mohler H., Fritschy J. M. (1996). Laminar compartmentalization of GABA(A)-receptor subtypes in the spinal cord: an immunohistochemical study. J. Neurosci. 16, 283–297. - PMC - PubMed
    1. Bowie D., Lange G. D., Mayer M. L. (1998). Activity-dependent modulation of glutamate receptors by polyamines. J. Neurosci. 18, 8175–8185. - PMC - PubMed