. 2014 Dec 23:8:239.
doi: 10.3389/fnsys.2014.00239. eCollection 2014.

Motion detection based on recurrent network dynamics

Affiliations

Motion detection based on recurrent network dynamics

Jeroen Joukes et al. Front Syst Neurosci. .

Abstract

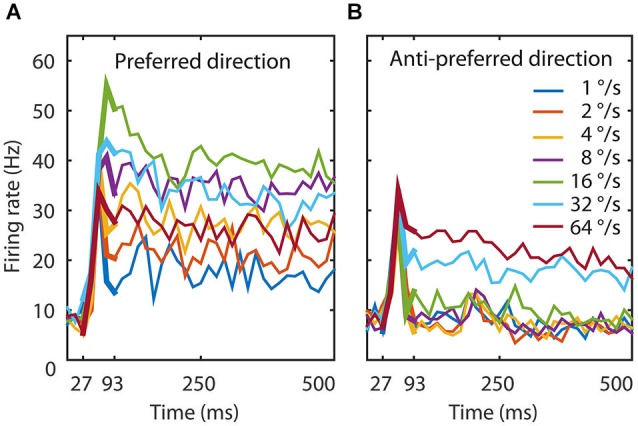
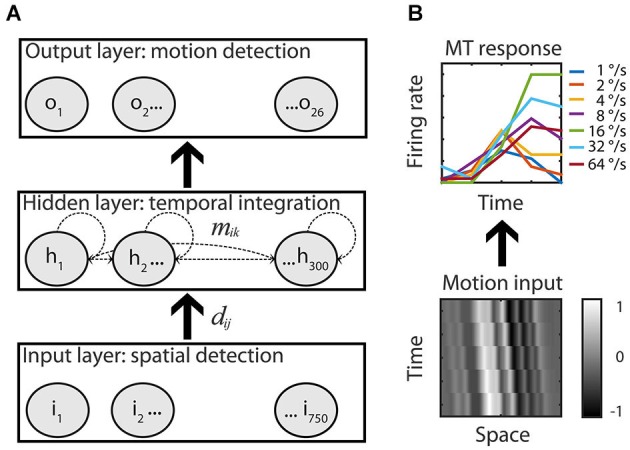
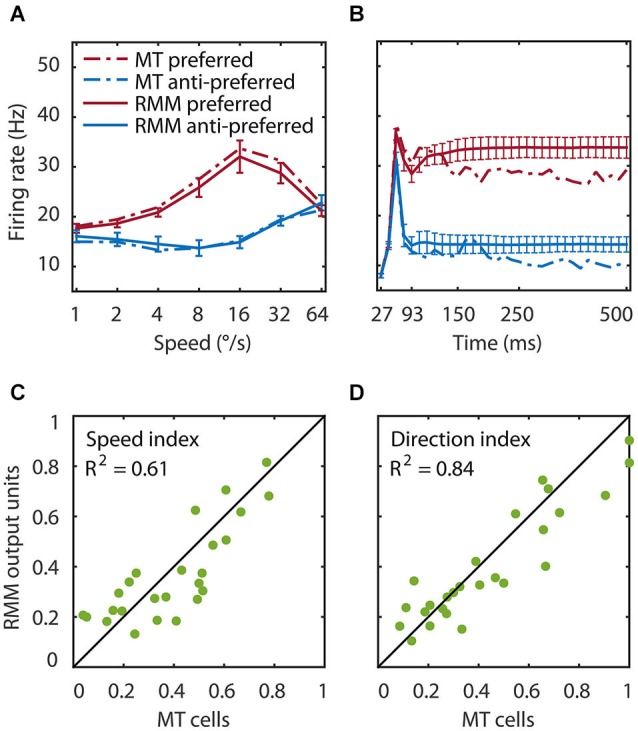
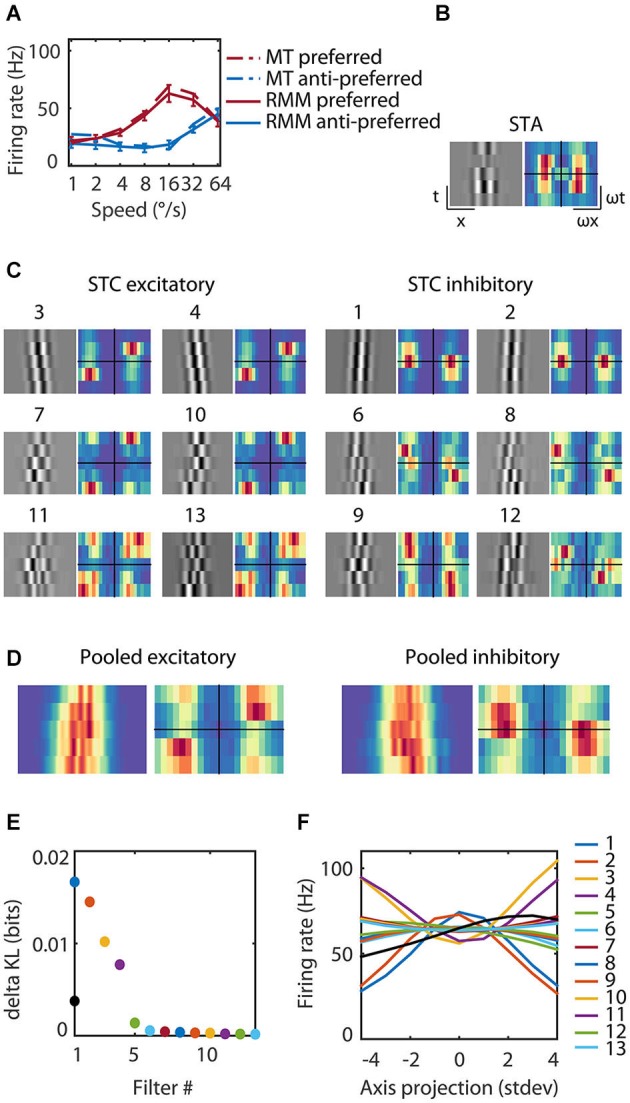
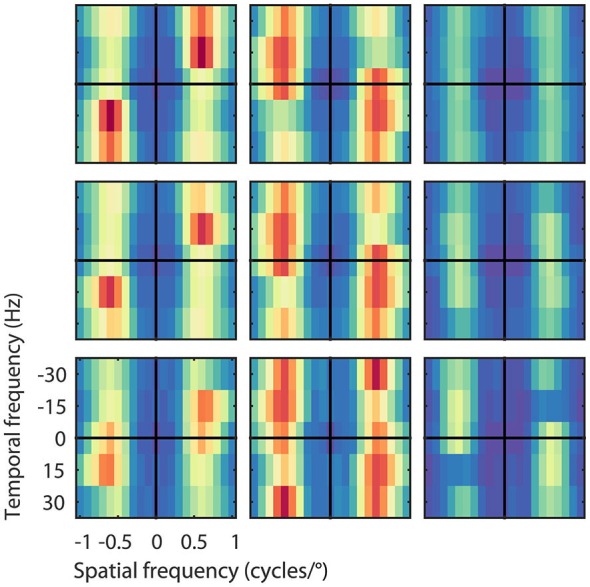
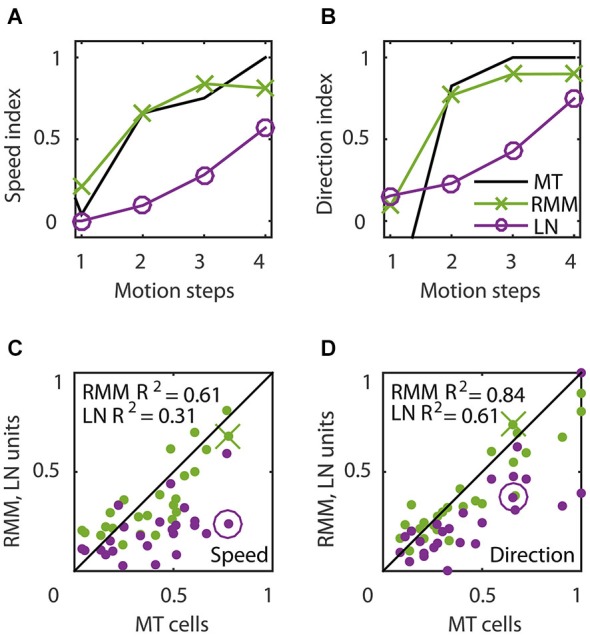
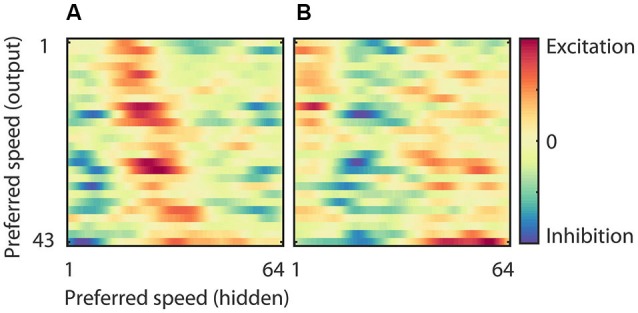
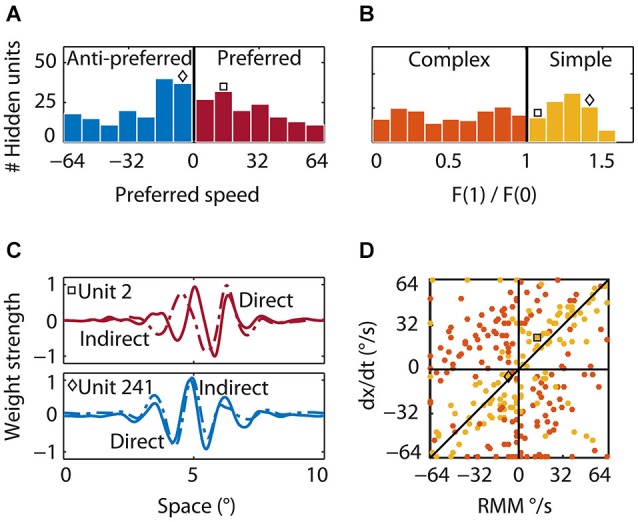
The detection of visual motion requires temporal delays to compare current with earlier visual input. Models of motion detection assume that these delays reside in separate classes of slow and fast thalamic cells, or slow and fast synaptic transmission. We used a data-driven modeling approach to generate a model that instead uses recurrent network dynamics with a single, fixed temporal integration window to implement the velocity computation. This model successfully reproduced the temporal response dynamics of a population of motion sensitive neurons in macaque middle temporal area (MT) and its constituent parts matched many of the properties found in the motion processing pathway (e.g., Gabor-like receptive fields (RFs), simple and complex cells, spatially asymmetric excitation and inhibition). Reverse correlation analysis revealed that a simplified network based on first and second order space-time correlations of the recurrent model behaved much like a feedforward motion energy (ME) model. The feedforward model, however, failed to capture the full speed tuning and direction selectivity properties based on higher than second order space-time correlations typically found in MT. These findings support the idea that recurrent network connectivity can create temporal delays to compute velocity. Moreover, the model explains why the motion detection system often behaves like a feedforward ME network, even though the anatomical evidence strongly suggests that this network should be dominated by recurrent feedback.

Keywords: middle temporal area; model; motion; recurrent connections; time.


Figures

Figure 1
Figure 1
Experimental data. (A) The temporal dynamics of the MT population to seven speeds in the preferred direction. The figure shows the average response of 26 MT neurons. The thin lines represent the response to the total duration of the stimulus, the thick lines the time window we used to train the network (27–93 ms). An initial transient lasted 67 ms during which speed tuning and direction selectivity started to emerge. Speed tuning was maximal around 93 ms and followed by a slow reduction in firing rate for most speeds. (B) The temporal dynamics of the MT population to seven speeds in the anti-preferred motion direction. Here too, the initial transient lasted 67 ms and direction selectivity was maximal around 93 ms, followed by slow adaptation. The onset response was not strongly direction selective, but after 93 ms the response to the preferred direction could be twice as large as the response to the anti-preferred direction. These data document that the response, speed tuning, and direction tuning change dynamically in the first 100 ms after stimulus presentation.
Figure 2
Figure 2
Recurrent motion model. (A) An Elman recurrent neural network with 750 input units all-to-all connected to the units of the hidden layer (dij). The hidden layer had 300 all-to-all recurrently and laterally connected hidden units (dashed lines, mik) that were all-to-all connected to the 26 output units of the RMM. Adjustable weights allowed the network to map motion inputs onto the speed tuned and direction selective response of the 26 recorded MT cells. (B) Example input-output. Low-pass filtered white noise patterns (range −1 to 1) shifted with 16°/s in the preferred motion direction over five time bins (bottom) is fitted to the measured response of the example MT cell to the preferred speed in the preferred motion direction (top, solid green line, the six other colors represent the non-preferred speeds).
Figure 3
Figure 3
Speed tuning and direction selectivity of the MT cells and RMM output units. We simulated the response of the RMM output units to 1000 new patterns and compared their response to the measured MT response. (A) The average response over the first 93 ms after stimulus onset. The response is shown for each of seven speeds in the preferred (red) and anti-preferred (blue) motion direction. The dotted lines represent the MT population response, the solid lines the population output of the RMM. The error bars indicate 1 standard deviation over trials. (B) The time course of the response averaged over the seven speeds for the trained number of time bins (27–93 ms) and for the full 500 ms of the experiment. (C,D) The speed tuning index (C) and direction selectivity index (D) for the output units (x-axis) and the MT cells (y-axis). This figure shows that the RMM faithfully captured the temporal dynamics (except for the short term adaptation) as well as the speed tuning and direction selectivity of both the MT population and the single cell response.
Figure 4
Figure 4
Reverse correlation analysis of the RMM output units. (A) The average response over the first 93 ms after stimulus onset for an example MT cell/output unit. The response is shown for each of seven speeds in the preferred (red) and anti-preferred (blue) motion direction. The dotted lines represent the example MT single cell response, the solid lines the example output unit of the RMM. The error bars indicate 1 standard deviation over trials. (C) The 13 filters of the RMM ordered by the amount of information (numbers above the filters show rank order). The STA displayed in (B) had no clear space time structure as expected for a polarity insensitive output unit and was almost identical to the fifth most informative filter (data not shown). The six excitatory filters (STC Excitatory) had a rightward slant; they were tuned to the preferred speed and direction, with increasing spatial frequencies per quadrature pair. The six suppressive filters (STC Suppressive) had a leftward slant; they were tuned to the anti-preferred direction, with increasing spatial frequencies per quadrature pair. The Fourier spectra are shown next to the 13 filters. For the excitatory filters power was concentrated around the preferred speed and direction of the output unit (16°/s). The Fourier spectra of the suppressive filters had a wider distribution of power over temporal frequency, ranging from stationary to the preferred temporal frequency in the anti-preferred direction and to fast speeds in the preferred direction. (D) Pooled excitatory and suppressive filters and Fourier spectra. The pooled excitatory and suppressive filters show that the individual filters largely overlap. The pooled excitatory and suppressive Fourier spectra exemplify the asymmetry of excitation and suppression. (E) The amount of information (in bits) contained within the STA (black), the excitatory filters and suppressive filters (see legend panel (F)). (F) The nonlinearities of the 13 filters. Stimuli that matched a filter (high positive axis projection) or that matched the polarity inverse (high negative axis projection) resulted in a high firing rate for the excitatory filters and a low firing rate for the suppressive filters.
Figure 5
Figure 5
Velocity computation with asymmetric excitation and suppression. Pooled excitatory, suppressive, and STA Fourier spectra of the filters (from left to right) for the 26 output units grouped by their preferred speed of 8, 16, and 32°/s (from bottom to top), normalized to the peak power per unit. Excitation was always centered on the preferred speed and direction of the unit, suppression was more broadly distributed across temporal frequencies. As expected, the STA had relatively little motion energy.
Figure 6
Figure 6
Temporal dynamics of speed tuning and direction selectivity. (A,B) Speed tuning index (A) and direction selectivity index (B) as a function of the number of motion steps for an example MT cell (black curve) and corresponding RMM output unit (green) and LN-model output (magenta). The speed and direction selectivity index of the example RMM and LN unit are displayed in (C) and (D) with a cross and circle, respectively. (C) Average speed tuning index over the motion steps, for all RMM output units (green) and their LN-models (magenta) compared to the speed tuning index of the corresponding MT cells. (D) Same as (C) for the direction selectivity index. This figure shows that, while the output units of the RMM captured the full speed tuning and direction selectivity properties of most MT cells, the LN model generally fails to do so.
Figure 7
Figure 7
Weights of the hidden to output units. (A) Strength of the connection between neurons in the hidden layer and those in the output layer sorted according to the preferred speed of the hidden units (x-axis) and the output units (y-axis) in the preferred motion direction. This panel shows, for instance, that the output units that preferred high speeds had excitatory connections to hidden units with high preferred speeds, and inhibitory connections to units with low preferred speeds. (B) Strength of the connection between neurons in the hidden layer and those in the output layer sorted according to the preferred speed of the hidden units in the anti-preferred motion direction (x-axis) and the preferred speed of the output units in the preferred motion direction (y-axis). This panel shows that many output units have relatively strong connections to neurons that prefer fast speeds in the anti-preferred direction and are inhibited by neurons that prefer low and intermediate speeds in the anti-preferred direction.
Figure 8
Figure 8
Properties of the hidden units. (A) Preferred speed. Roughly half of the hidden units were tuned to the preferred (red bars) and half to the anti-preferred motion direction (blue bars) of the output units. Whereas many units that were tuned to the preferred direction were tuned to the average preferred speed of the output units, many units that were tuned to the anti-preferred direction were tuned to lower than the preferred speed. The square indicates the preferred speed of the first example hidden unit and the diamond the preferred speed of the second example hidden unit in (B) and (C). (B) Relative response modulation. We classified simple (yellow bars) and complex hidden units (orange bars) according to the conventional cutoff value of F1/F0 = 1. The square and diamond use the same convention as in (A). (C) Direct and indirect inputs for two example hidden units. The first unit (top; square) was tuned to the preferred motion direction of the RMM output units. The direct (solid) and indirect (dashed) input weight distribution were Gabor-like and the indirect input was shifted to the left of the direct input. The second example unit (bottom; diamond) was tuned to the anti-preferred motion direction of the RMM output population and had an indirect peak input shifted to the right of the direct peak input. (D) The preferred speed of the simple (yellow) and complex (orange) hidden units as predicted by a linear summation scheme (y-axis) plotted against the actual preferred speed (x-axis). Positive values show the preferred speed in the preferred direction. Negative values show the preferred speed in the anti-preferred direction. Most simple-like hidden units (like the two example units) were not on the diagonal. This shows that the RMM does not use a motion-energy like linear computation with fixed delays between spatially shifted detectors to compute velocity. This is even more pronounced for the complex-like units where the real preferred motion direction was often opposite to the prediction of the linear summation scheme (opposite quadrants).

References

    1. Adelson E. H., Bergen J. R. (1985). Spatiotemporal energy models for the perception of motion. J. Opt. Soc. Am. A 2, 284–299. 10.1364/josaa.2.000284 - DOI - PubMed
    1. Albright T. D. (1984). Direction and orientation selectivity of neurons in visual area MT of the macaque. J. Neurophysiol. 52, 1106–1130. - PubMed
    1. Bayerl P., Neumann H. (2004). Disambiguating visual motion through contextual feedback modulation. Neural Comput. 16, 2041–2066. 10.1162/0899766041732404 - DOI - PubMed
    1. Blasdel G. G., Fitzpatrick D. (1984). Physiological organization of layer 4 in macaque striate cortex. J. Neurosci. 4, 880–895. - PMC - PubMed
    1. Chey J., Grossberg S., Mingolla E. (1998). Neural dynamics of motion processing and speed discrimination. Vision Res. 38, 2769–2786. 10.1016/s0042-6989(97)00372-6 - DOI - PubMed

LinkOut - more resources