. 2015 Jan 8;517(7533):165-169.
doi: 10.1038/nature13995.

Human gut Bacteroidetes can utilize yeast mannan through a selfish mechanism

Affiliations

Human gut Bacteroidetes can utilize yeast mannan through a selfish mechanism

Fiona Cuskin et al. Nature. .

Erratum in

  • Corrigendum: Human gut Bacteroidetes can utilize yeast mannan through a selfish mechanism.
    Cuskin F, Lowe EC, Temple MJ, Zhu Y, Cameron EA, Pudlo NA, Porter NT, Urs K, Thompson AJ, Cartmell A, Rogowski A, Hamilton BS, Chen R, Tolbert TJ, Piens K, Bracke D, Vervecken W, Hakki Z, Speciale G, Munōz-Munōz JL, Day A, Peña MJ, McLean R, Suits MD, Boraston AB, Atherly T, Ziemer CJ, Williams SJ, Davies GJ, Abbott DW, Martens EC, Gilbert HJ. Cuskin F, et al. Nature. 2015 Apr 16;520(7547):388. doi: 10.1038/nature14334. Epub 2015 Mar 4. Nature. 2015. PMID: 25739504 No abstract available.

Abstract

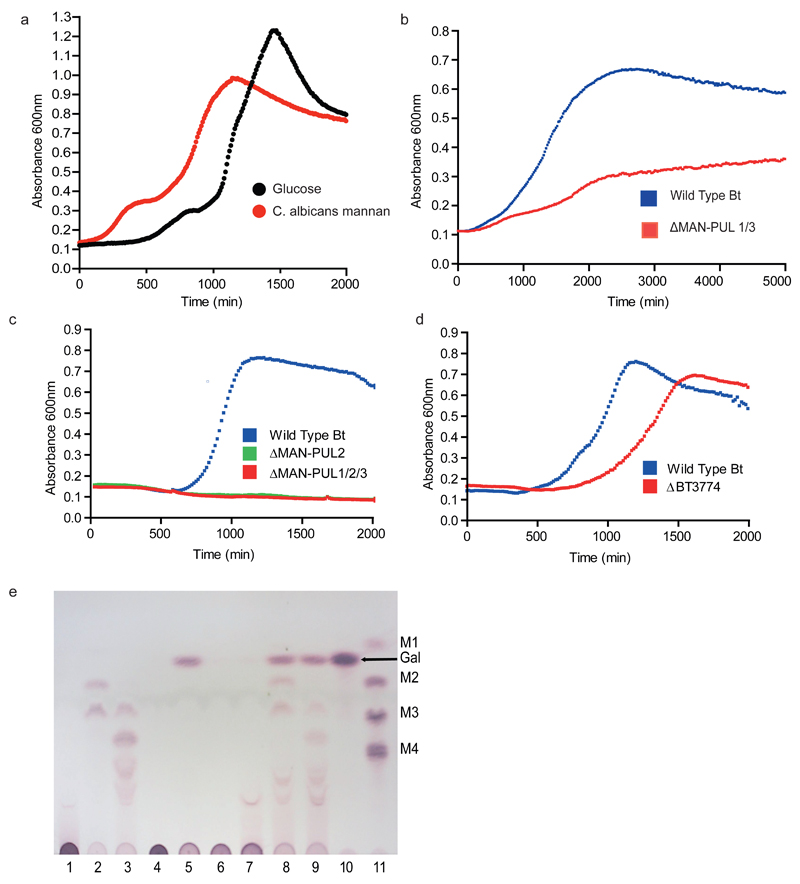
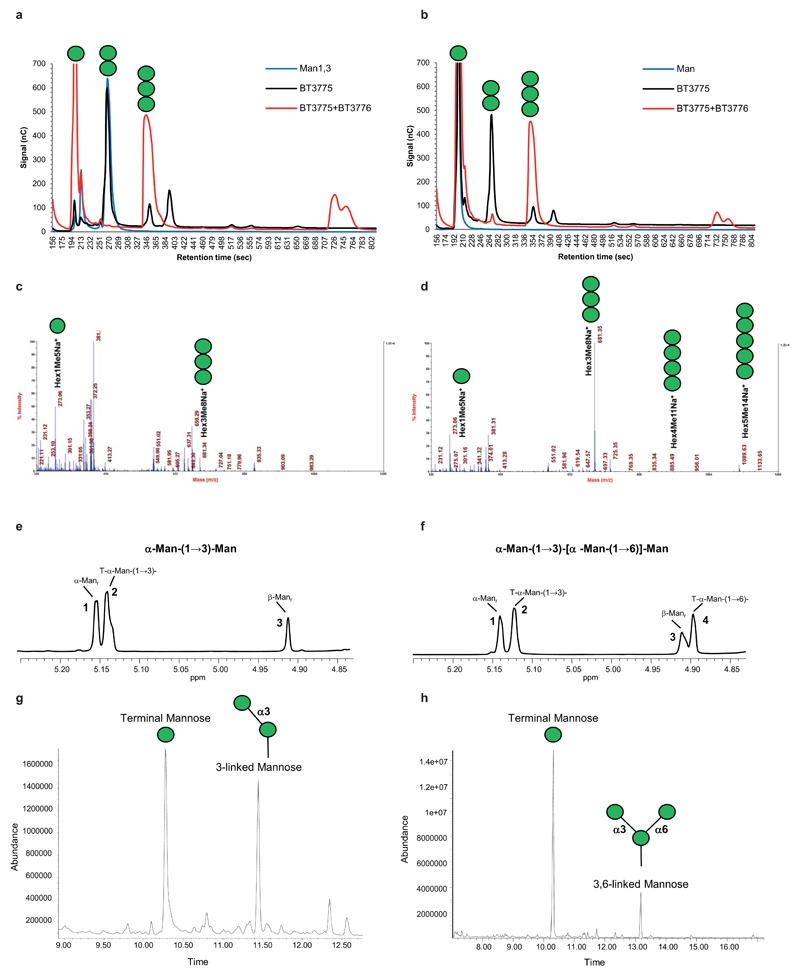
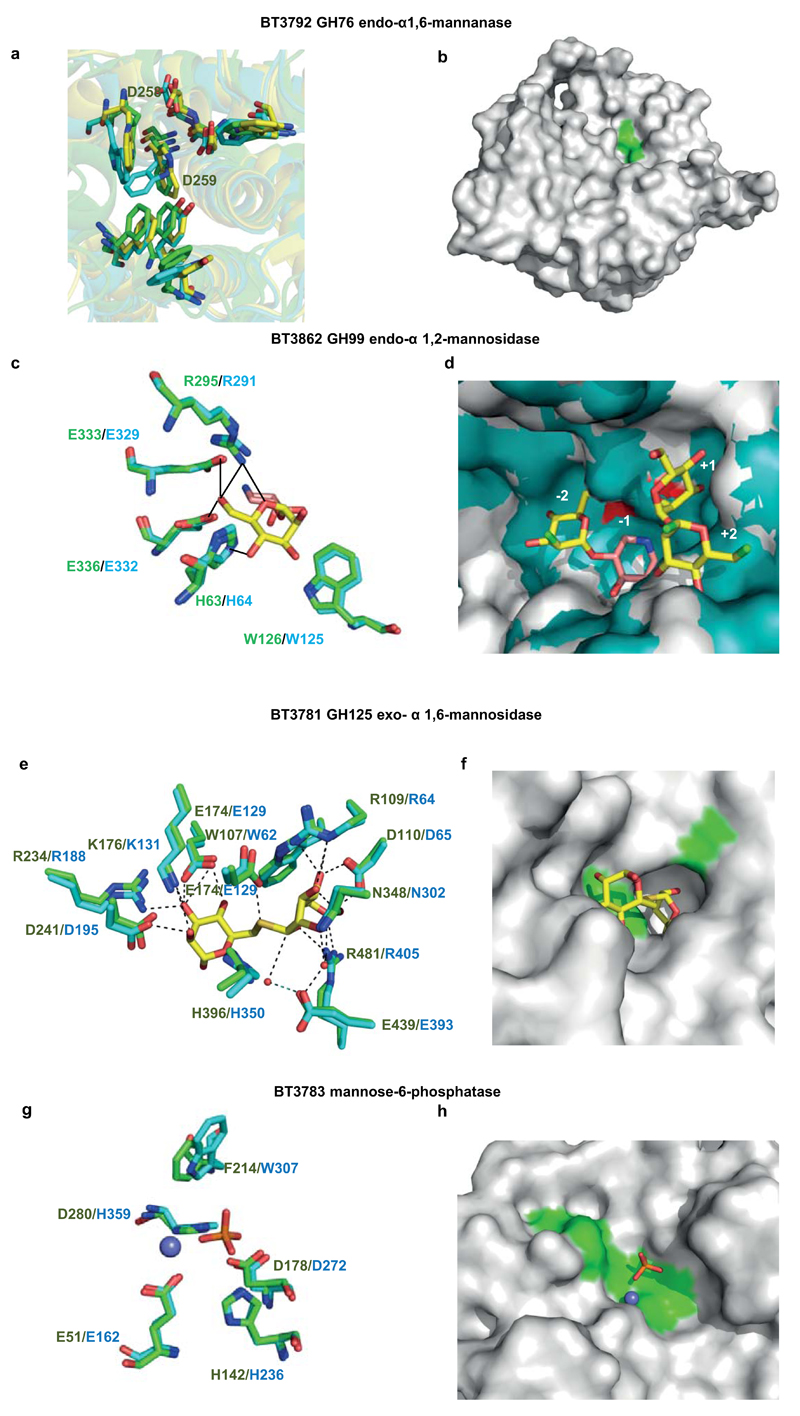
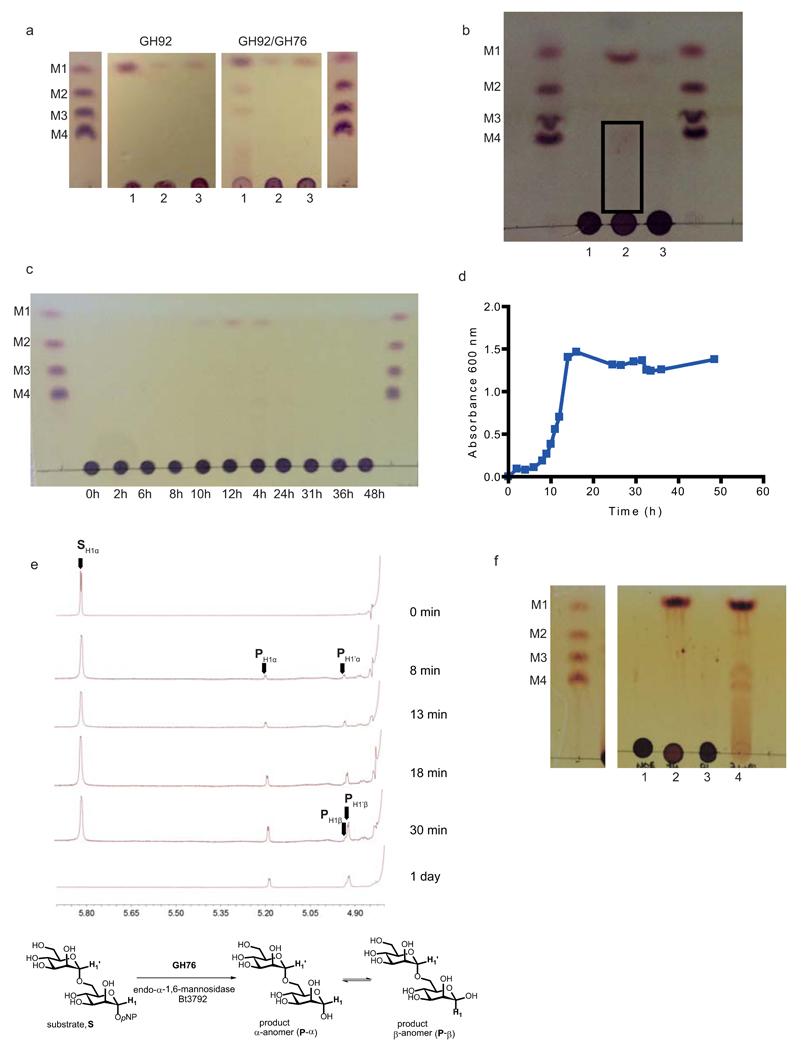
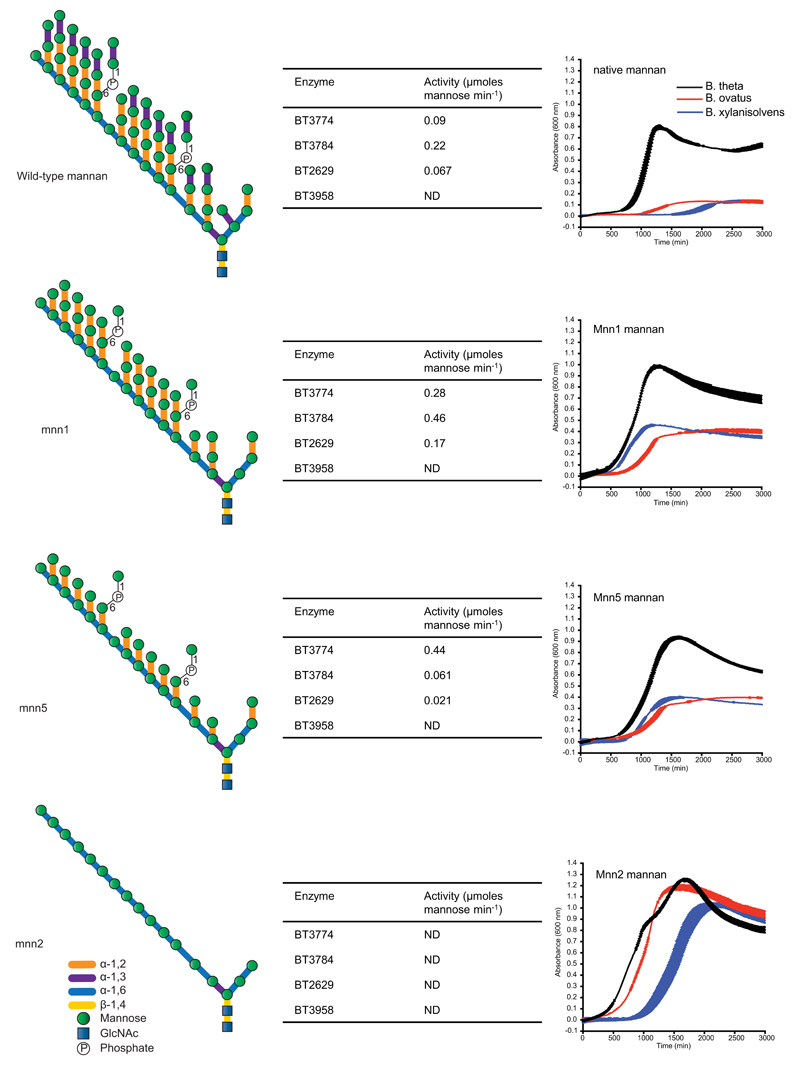
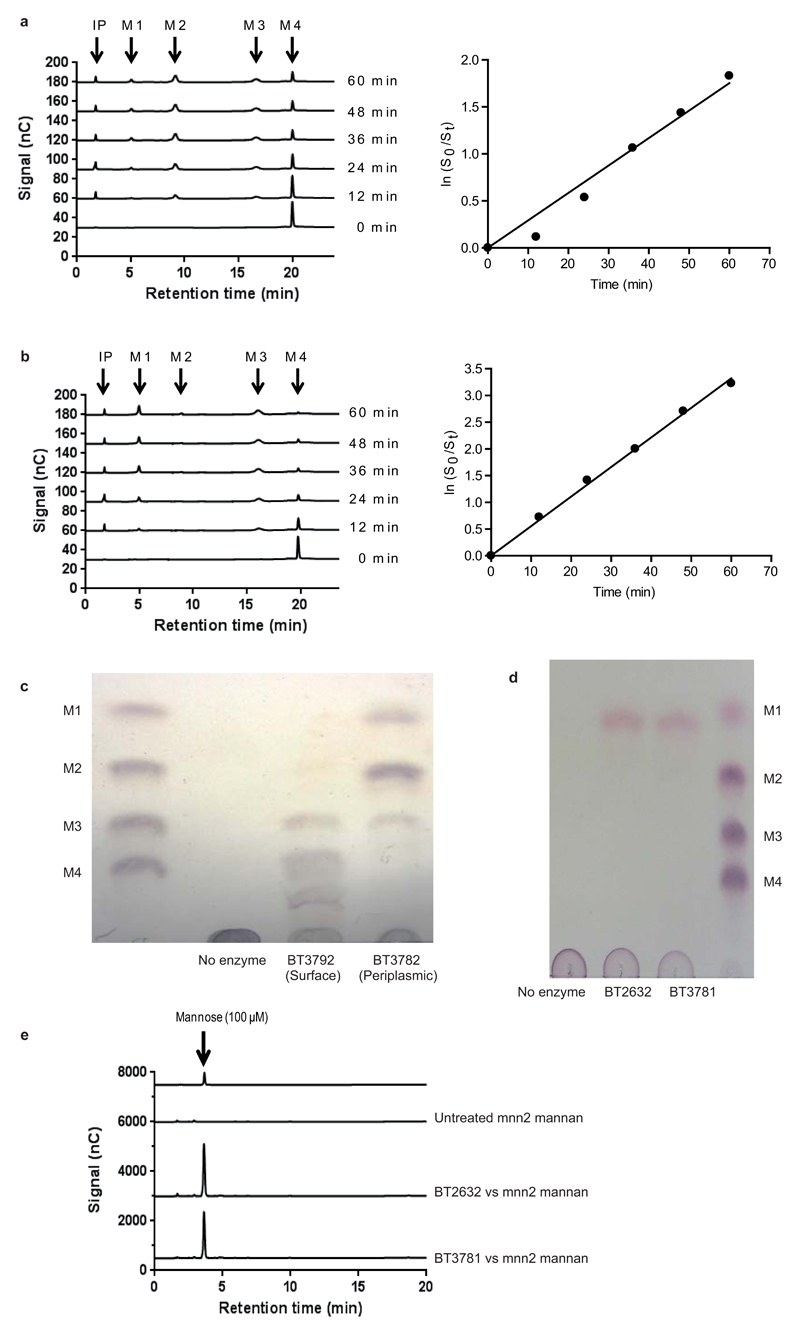
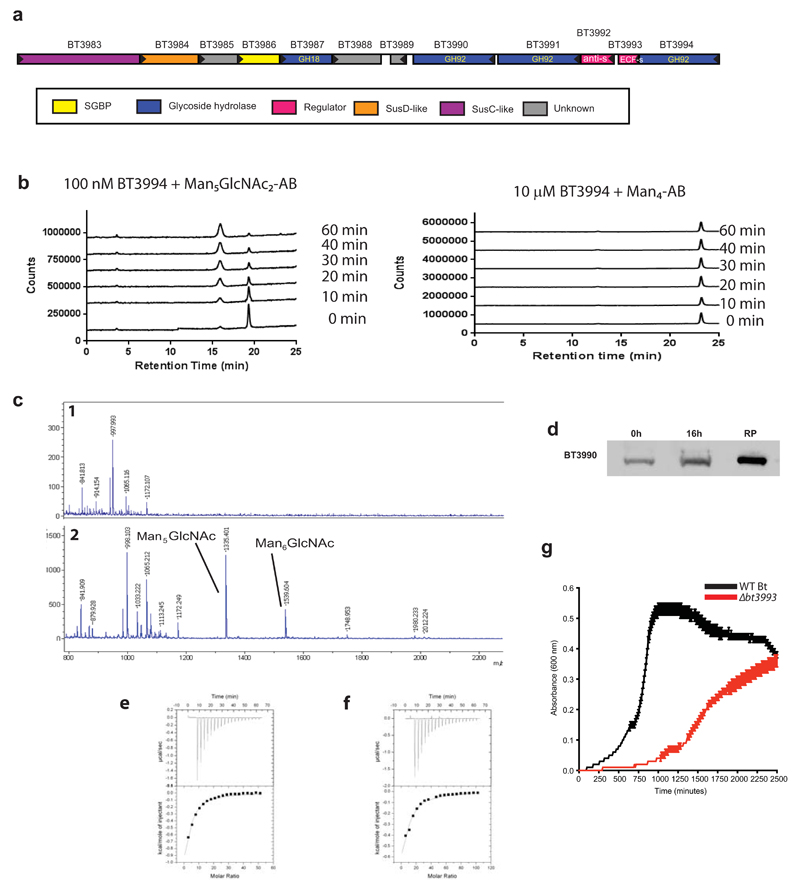
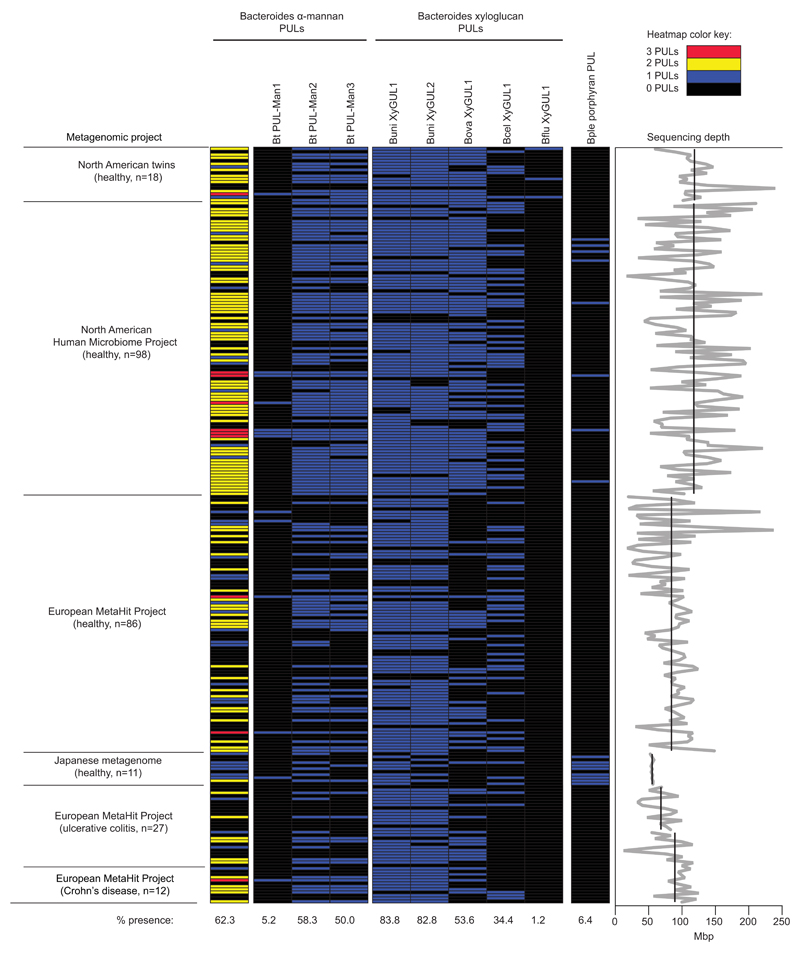
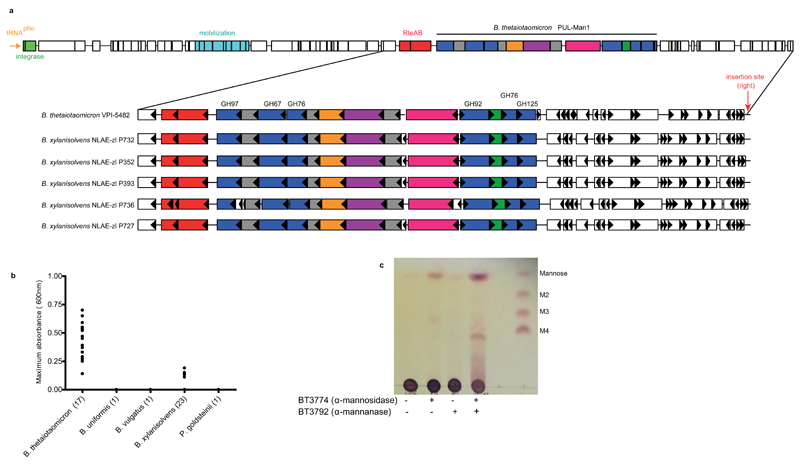
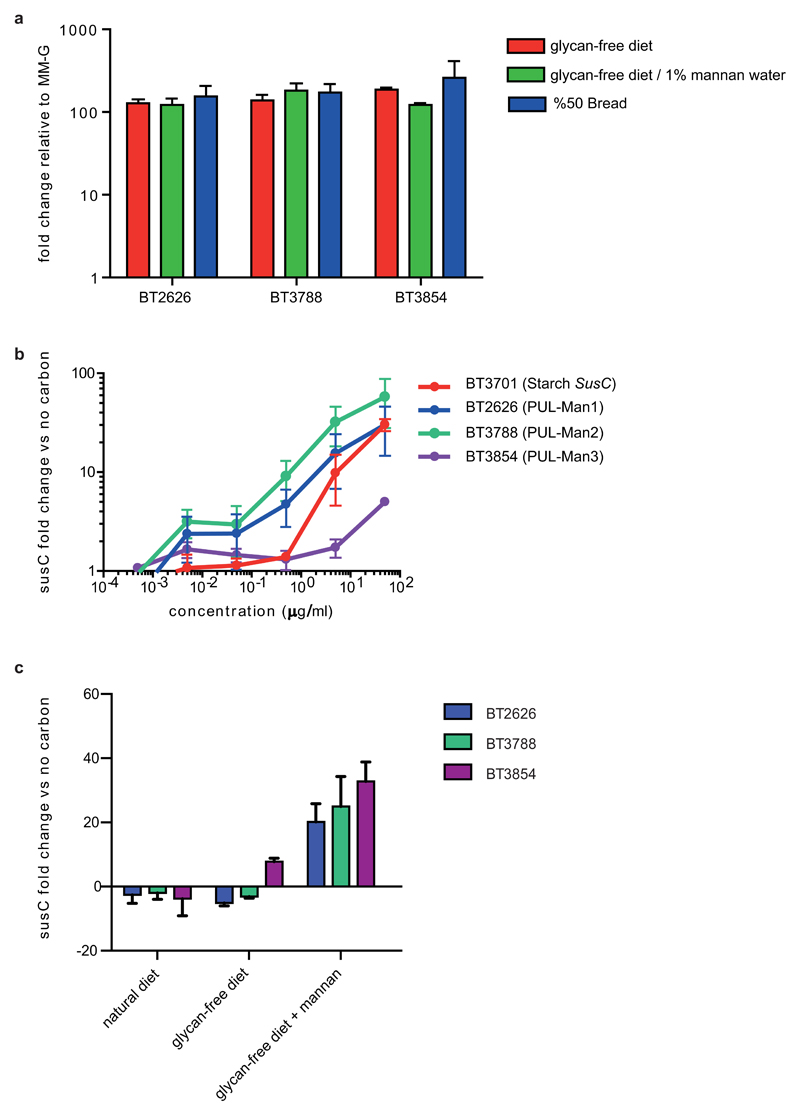
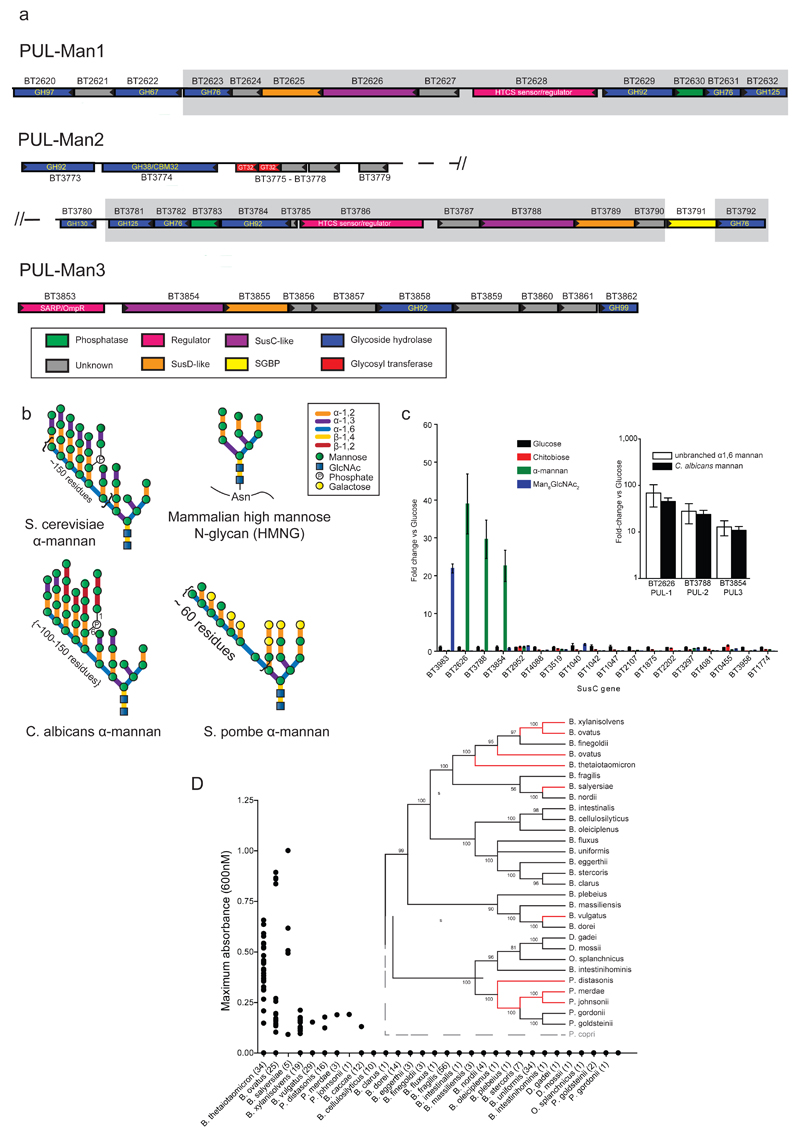
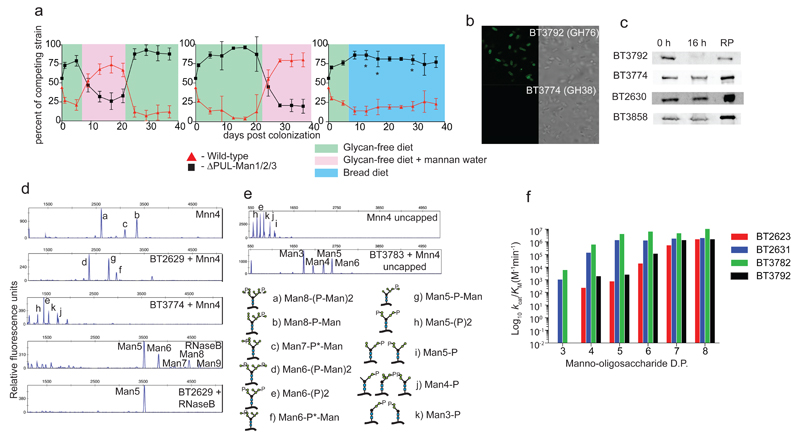
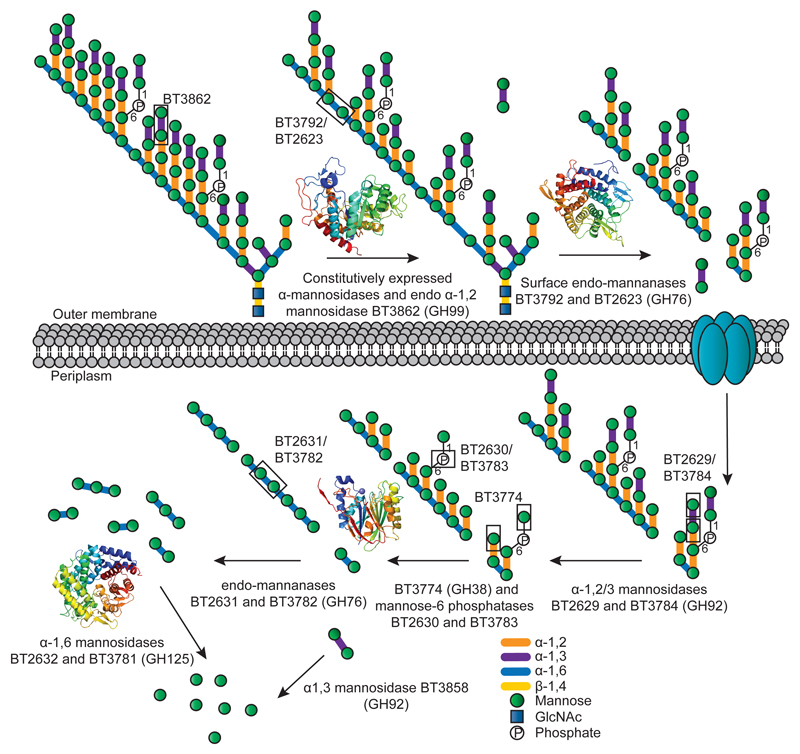
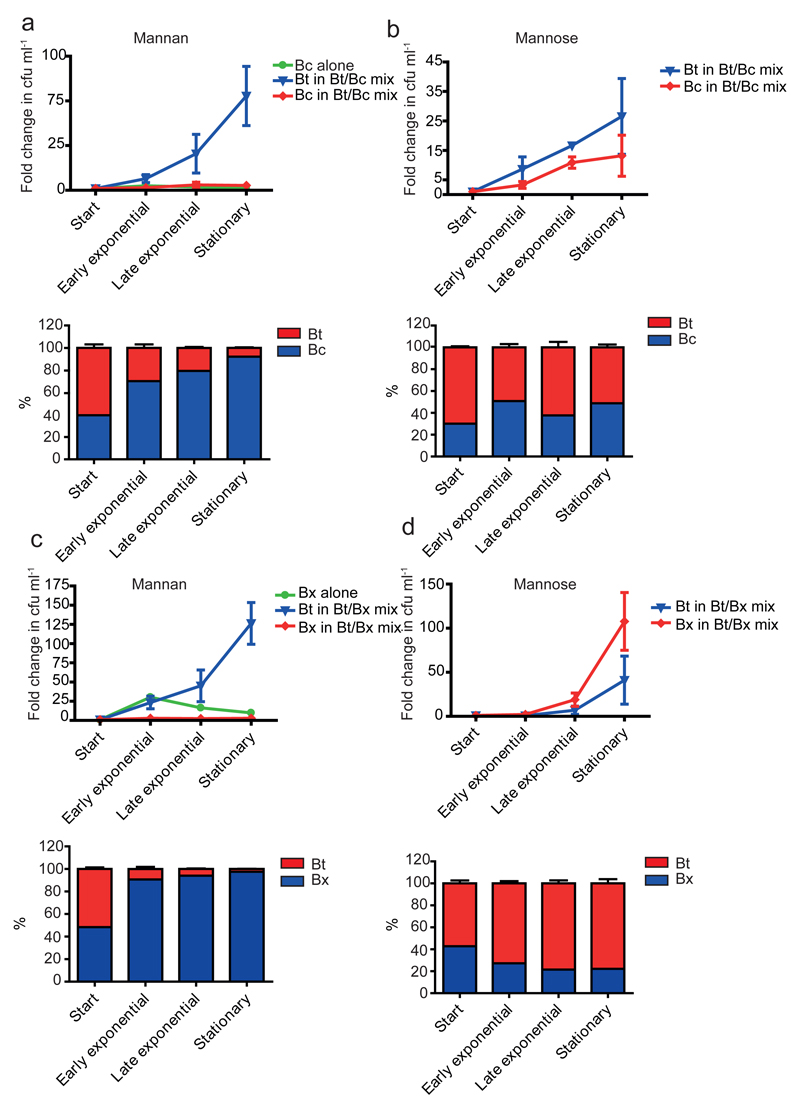
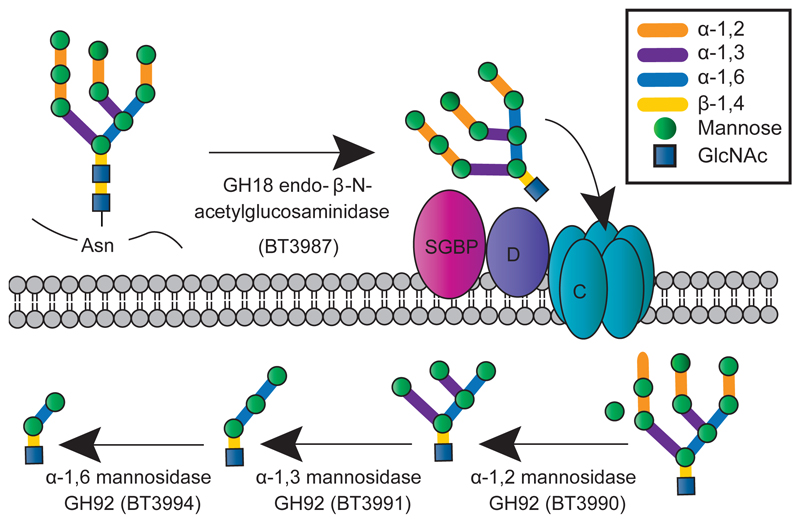
Yeasts, which have been a component of the human diet for at least 7,000 years, possess an elaborate cell wall α-mannan. The influence of yeast mannan on the ecology of the human microbiota is unknown. Here we show that yeast α-mannan is a viable food source for the Gram-negative bacterium Bacteroides thetaiotaomicron, a dominant member of the microbiota. Detailed biochemical analysis and targeted gene disruption studies support a model whereby limited cleavage of α-mannan on the surface generates large oligosaccharides that are subsequently depolymerized to mannose by the action of periplasmic enzymes. Co-culturing studies showed that metabolism of yeast mannan by B. thetaiotaomicron presents a 'selfish' model for the catabolism of this difficult to breakdown polysaccharide. Genomic comparison with B. thetaiotaomicron in conjunction with cell culture studies show that a cohort of highly successful members of the microbiota has evolved to consume sterically-restricted yeast glycans, an adaptation that may reflect the incorporation of eukaryotic microorganisms into the human diet.


Conflict of interest statement

The authors have no competing interests.

Figures

Extended Data Fig. 1
Extended Data Fig. 1. The role of specific Bt PULs and enzymes in utilization of mannan from S. cerevisiae and other yeast species.
a, growth of wild type Bt on Candida albicans mannan and glucose. b, growth of wild type Bt and the mutant lacking PUL-Man1 and PUL-Man3 (ΔPUL-Man1/3) on Schizosaccharomyces pombe α-mannan. c, growth of wild type Bt, and the Bt mutants lacking Pul-Man2 (ΔPUL-Man2), or all three mannan PULs (ΔPUL-Man1/2/3) on S.cerevisiae α-mannan. d, displays the growth profile of wild-type Bt and the Bt mutant lacking bt3774 (Δbt3774) on S. cerevisiae mannan. In panels a, b, c and d, each point on the growth curve represents the mean of three biological replicates. e, enzymes at 1 µM at 37 °C were incubated with either undecorated α-1,6-mannan (derived from mnn2 mutant of S. cerevisiae), lanes 1-3, or mannan from S. pombe, lanes 4-9. Lanes 1 and 4, the mannans incubated in the absence of the enzymes; lanes 2 and 6, mannans incubated with the periplasmic mannanase BT3782, and in lanes 3 and 7 the surface mannanase BT3792; lane 5, S. pombe mannan incubated with the GH97 α-galactosidase BT2620; lanes 8 and 9, S. pombe mannan incubated with BT2620/BT3782 and BT2620/BT3792, respectively. Lane 10 galactose standard; lane 11 α-1,6-mannooligosaccharides: mannose (M1), mannobiose (M2), mannotriose (M3) and mannotetraose (M4).
Extended Data Fig. 2
Extended Data Fig. 2. Product profiling of GT32 glycosyltransferases encoded by PUL-Man2.
a, HPAEC of biosynthetic reactions using mannose as an acceptor and GDP-α-Man as the donor. Mannobiose is formed in the presence of BT3775 (black) and mannotriose with BT3775 and BT3776 (red). The blue trace is a mannose standard. b, HPAEC of biosynthetic reactions with α1,3-mannobiose as the acceptor and GDP-α-Man as the donor. BT3775 is not capable of extending mannobiose (black). In the presence of BT3775 and BT3776 mannotriose is produced (red). The blue trace is an α1,3-mannobiose standard. MALDI-TOF analysis of the reaction products of BT3775 + BT3776 using c, mannose and d, α1,3-mannobiose as an acceptor. e, NMR analysis of the α1,3-mannobiose substrate. Peaks (1) and (3) correspond to the α-anomer and β-anomer of the mannose at the reducing end, respectively; peak (2) corresponds to the terminal α-mannosyl residue linked to O-3 of the mannose at the reducing end. f, NMR analysis of the α1,3,(α1,6)-mannotriose BT3776 product. The numbering of the peaks are the same as in e. Peak 4 corresponds to the terminal α-mannosyl residue linked to 0-6 of the 3,6-linked mannose at the reducing end. g, alditol-acetate linkage analysis of mannobiose produced by BT3775 from mannose. h, alditol-acetate linkage analysis of branched (α1,3),(α1,6)-mannotriose produced by BT3776 from α1,3-mannobiose. The green circles indicate the mannose residues present in carbohydrates identified by HPAEC, MALDI-TOF and NMR.
Extended Data Fig. 3
Extended Data Fig. 3. The structures of enzymes that play a key role in yeast mannan degradation.
a, overlay of the hydrophobic conserved residues in the predicted substrate-binding cleft of BT3792 (yellow), BT2949 (cyan) and the Listeria protein Lin0763 (green; PDB code 3K7X), and the predicted catalytic aspartates. b, solvent representation of BT3792 in which the predicted catalytic residues, Asp258 and Asp259, are coloured green. c, overlay of BT3862 (cyan) with a homolog of the enzyme from B. xylanisolvens, BxGH99 (green; PDB code 4UTF) in complex with Man-α1,3-isofagomine and α-1,2-mannobiose (Man residues coloured yellow and isofagomine pink). d, solvent exposed surface of the substrate binding cleft of the BxGH99 (teal) ligand complex overlaid with BT3862 (grey). The subsites are numbered with the catalytic residues, Glu333 and Glu336, coloured red and the solvent exposed O2 of Man bound at the -2 subsite and O1 and O6 of the Man located at the +2 subsite are coloured bright green. e, overlay of BT3781 (green; PDB code 2P0V) with the substrate and catalytic residues of the Clostridium perfringens GH125 α-mannosidase CpGH125 (cyan; PDB code 3QT9), in which the ligand 6-S-α-D-mannopyranosyl-6-thio-a-D-mannopyranose (Man-S-Man) is shown in yellow. f, solvent exposed surface of BT3781 in the vicinity of the active site in which the catalytic residues (Glu174 and Glu439) are depicted in green. The position of Man-S-Man is based on the overlay shown in e. g, overlay of BT3783 with the catalytic and substrate binding residues of a tyrosyl-DNA phosphodiesterase (PDB code 4GYZ) in complex with Mg2+ (slate blue sphere) and phosphate (coloured orange). h, a region of the solvent accessible surface of BT3783 in which the catalytic residues are coloured green. The figure was prepared using PyMOL. A detailed description of the structures of these proteins is provided in Supplementary Information Section 5.
Extended Data Fig. 4
Extended Data Fig. 4. The degradation of yeast mannan by Bt in culture and the selected enzymes expressed by the bacterium, and the stereochemistry of the reaction catalyzed by GH76 endo-α1,6-mannanases.
a, GH92 α-mannosidases at high concentrations (50 µM) were incubated with yeast mannan for 5 h in the absence (labelled GH92) or in the presence (GH92/GH76) of the endo-α1,6-mannanase BT3782. The GH92 α-mannosidases in this example were BT2199 (1), BT2130 (2) and BT3773 (3). The GH76 endo-α1,6-mannanase only releases mannooligosaccharides in the presence of BT2199; see also Supplementary Information Section 4.1. b, Bt was grown on yeast mannan or glucose. Yeast mannan was incubated with no bacterium (1), Bt previously cultured on yeast mannan (2) and Bt grown on glucose. The cells were incubated for 5 h at 37 °C with the polysaccharide without a nitrogen source and thus were not growing. The products released by the Bt cells, analysed by TLC, were mediated by the activity of enzymes presented on the surface of Bt, and not through the action of periplasmic mannanases and mannosidases. The black box highlights very low levels of high molecular weight mannooligosaccharides generated by the cells incubated in yeast mannan. c, Bt was cultured for up to 48 h (stationary phase) on yeast mannan. The supernatant of the culture at the time points indicated were analyzed by TLC. In all panels the samples were chromatographed with the following α1,6-mannooligosaccharides: mannose (M1); mannobiose, M2; mannotriose, M3; mannotetraose, M4. d, the absorbance of the culture used in C. e, BT3792 (GH76) endo-α-1,6-mannosidase is a retaining glycoside hydrolase. Enzymatic hydrolysis of 4-nitrophenyl α-D-mannopyranosyl-1,6-α-D-mannopyranoside (S) was monitored by 1H-NMR spectroscopy (500 MHz). The stacked spectra show the reaction progress over time. SH1α is the anomeric proton of the reducing end mannopyranoside of the substrate, and SH1’α is the anomeric proton of the non-reducing end mannopyranoside. The reaction proceeds with the initial formation of the product, the α-anomer of α-1,6-mannobiose (P-α, peaks PH1α and PH1’α), which slowly mutarotates to the β-anomer (P-β, peaks PH1β and PH1’β). f, TLC analysis of S. cerevisiae mannan incubated without enzyme (lane 1), BT3774 (lane 2), BT3792 (lane 3, BT3774 and BT3792 (lane 4). M1-M4 are α-mannnooligosaccharide standards numbered according to their d.p. f, GH76 mannanase BT3792 does not attack the backbone of S. cerevisiae mannan unless the side chains are first removed by the GH38 α-mannosidase BT3774, confirming that this enzyme cleaves the mannose linked α-1,2 to the mannan backbone. The data in a, b and c are representative of two biological replicates, while the data in f are representative of two technical replicates.
Extended Data Fig. 5
Extended Data Fig. 5. The activity of periplasmic α-mannosidases and the growth of different species of Bacteroides against yeast mannan.
Structures of the mannans derived from wild type and mutants of S. cerevisiae. The tables adjacent to the different yeast structures depict the initial rate of mannan hydrolysis by the four enzymes. The growth curves adjacent to the different mannan structures show the growth profile of Bt (black), B. ovatus (red) and B. xylanisolvens (blue) on the glycans (each point represents the mean growth of 3 separate cultures ± s.d.). The porcine-derived B. xylanisolvens strain shown here acquired PUL-Man1 by lateral gene transfer, Extended Data Fig. 9, explaining its capacity to degrade processed mannans. Vertical error bars represent standard deviation of three separate replicates in each condition.
Extended Data Fig. 6
Extended Data Fig. 6. The activity of GH76 α-mannanases and GH125 α-mannosidases
a, b, BT3792 and BT3782, respectively, were incubated with α1,6-mannotetraose at a concentration ≪KM. Substrate depletion was measured using HPAEC and the rate (right hand of a and b) enabled kcat/KM to be determined. c, BT3792 and BT3782 were incubated with unbranched yeast mannan (derived from the S. cerevisiae mutant MNN2). The yeast mannan at 1% was incubated with the two GH76 α1,6-mannanases for 1 h at 37 °C in 50 mM sodium phosphate buffer, pH 7.0. The limit products were analyzed by TLC. d, e, BT2632 and BT3781 at 100 nM were incubated with 1 mg/ml of the debranched mannan for 1 h in the buffer described above. d displays TLC analysis of the reactions, while e shows HPAEC traces. α1,6-Mannooligosaccharides identified by their degree of polymerization (M1, mannose; M2, mannobiose; M3, mannotriose; M4, mannotetraose) and IP is the injection peak. The data in c and d are representative of two technical replicates.
Extended Data Fig. 7
Extended Data Fig. 7. HMNG deconstruction by Bt.
a, Structure of the HMNG PUL. Genes drawn to scale with its orientation indicated. Genes encoding known or predicted functionalities are color-coded and, where appropriate, are also annotated according to their CAZy glycoside hydrolase family (GH) number. SGBP represents a Surface Glycan Binding Protein. b, BT3994 was incubated with α1,6-mannotetraose (Man4-AB) or the high mannose N-glycan Man5GlcNAc2, with both oligosaccharides labelled with 2-aminobenzamide (AB). At the indicated time points aliquots were removed and analysed by HPAEC using a fluorescence detection system. While Man5GlcNac2-AB was hydrolyzed by BT3994, the enzyme was not active against Man4-AB. c, chicken ovalbumin was incubated with buffer (1) or 1 µM of BT3987 (2) in 20 mM Na-HEPES buffer, pH 7.5, for 5 h at 37 °C, and the soluble material was permethylated and analyzed by MALDI-TOF mass spectrometry. The high mannose N-glycans released are labelled. d, depicts a western blot of Bt cells cultured on yeast mannan that were untreated with proteinase K (0 h) or incubated with 2 mg/ml proteinase K for 16 h (16 h). The lane labelled RP contained purified recombinant form of BT3990. The blots were probed with antibodies against BT3990. The data in d are representative of two biological replicates. e, representative isothermal calorimetry titrations (ITCs) for BT3984 titrated with Gal-β1,4-GlcNAc (LacNAc; (25 mM), and f, for BT3986 titrated with mannose (50 mM). The top half of each panel shows the raw ITC heats; the bottom half, the integrated peak areas fitted using a one single binding model by MicroCal Origin software. ITC was carried out in 50 mM Na/HEPES, pH 7.5 at 25 °C. The affinities and thermodynamic parameters of binding are showing in Supplementary Table 5. g, shows the growth profile of wild type Bt (WT Bt; black) and the mutant Δbt3993 (red), which lacks the ECF-σ regulator gene of PUL-HMNG, cultured on Man8GlcNAc2(each curve shows the mean ± s.d. of 3 separate cultures).
Extended Data Fig. 8
Extended Data Fig. 8. Metagenomic analysis of the occurrence of the yeast mannan PULs in humans.
Abundance of Bacteroides mannan PULs in human from a survey of metagenomic sequencing data from a total of 250 adult human samples (211 healthy, 27 ulcerative colitis, 12 Crohn’s Disease; see Methods for references). Datasets were individually queried by BLAST using either each entire mannan PUL (PULs 2,3) or a sub-fragment that was trimmed to eliminate cross-detection of other species genomes beyond Bt and porcine B. xylanisolvens (PUL1; see Methods for additional search details). Each horizontal line represents the presence of a hit in a single individual. The leftmost column summarizes the total mannan PUL content in each person (annotated according to the color key in the upper right corner). The mannan PUL frequency across all 250 samples is shown at the bottom for each condition and is compared to the frequency of several other PULs implicated in xyloglucan and porphyran utilization. Graph at far right illustrates the variation in sequencing depth for each sample/study: black lines show the average depth in megabasepairs (Mbp) for each study; the light gray line shows the depth for each individual sample.
Extended Data Fig. 9
Extended Data Fig. 9. Presence of a conjugative transposon (cTn) that harbors PUL-Man1 in the genomes of porcine B. xylanisolvens strains and the mannan presented to these organisms.
a, shown across the top is a schematic of a cTn that has been integrated into the 3' end of a tRNAphe gene in Bt strain VPI-548243. Integration is mediated by a 22 bp direct repeat sequence that is contained in tRNAphe and repeated again at the other side of the cTn (insertion site right). The location of Bt PUL-Man1 is denoted within the larger cTn element using a colour scheme identical to Fig. 1a. The lower panel shows an expanded view of the PUL-Man1 locus in five sequenced strains of B. xylanisolvens from the feces of pigs fed a diet enriched with distillers grains that were fermented with yeast. A nearly identical copy (both by amino acid homology and syntenic organization) of this genomic region is present in Bt and the porcine B. xylanisolvens strains. Although the draft genomes of the B. xylanisolvens strains contains gaps in all 5 assemblies at the left side of the PUL-Man1, the right side insertion site was resolved in all genomes, suggesting that the B. xylanisolvens loci were also transferred by lateral transfer at some point in the history of these strains. b, 43 different strains from five Bacteroidetes isolated from animal guts (each indicated with a solid circle) were inoculated into minimal media containing S. cerevisiae mannan as the sole carbon source. The growth of the cultures was measured over 48 h by recording the optical density at 600 nm. c, TLC analysis of the products generated by incubating BT3774 and BT3792 with α-mannan extracted from the distillers grain fed to the pigs from which the B. xylanisolvens were isolated. The data are representative of two technical replicates.
Extended Data Fig. 10
Extended Data Fig. 10. In vivo and in vitro expression of the mannan PULs.
a, level of susC-like transcripts derived from PUL-Man1 (BT2626), PUL-Man2 (BT3788) and PUL-Man3 (BT3854) from Bt in monocolonized gnotobiotic mice fed a “glycan-free” diet deficient in Bt-digestible glycans (red), the same diet with added yeast mannan (1% w/v in drinking water) as the only usable polysaccharide (green), and a diet containing 50% bread (blue). The levels of the susC transcripts were quantified relative to the same mRNA species in Bt cultured in vitro on glucose minimal medium (MM-G). Note that in all cases, expression of PUL-Man genes is equally high in vivo. b, transcription of the same mannan susC-like genes in response to increasing concentrations of yeast mannan in the media after 30 min exposure. The prototypic susC (BT3701) involved in starch metabolism is shown for comparison. c, an identical exposure experiment to that shown in Panel B, except that glucose-grown Bt cells were exposed to aqueous extracts of the cereal grain diet (natural diet) fed to mice prior to the experiment, or the digestible glycan free control diet (glycan-free diet) used as a base for all feeding treatments. Exposure was conducted for 30 min to determine if any diet extract contained contaminating levels of mannan that could be detected by Bt cells; inclusion of purified mannan (5 mg/ml) in addition to the glycan-free diet serve as positive controls. In all panels, the results represent the mean of 3 biological replicates and error bars represent s.d.
Fig. 1
Fig. 1. B. thetaiotaomicron PULs involved in yeast α-mannan metabolism, and utilization of the glycan in Bacteroidetes.
a, Genes encoding known or predicted functionalities are color-coded and, where appropriate, annotated according to their CAZy family. SGBP; Surface Glycan Binding Protein. b, structures of yeast (S. cerevisiae) mannan and HMNG. c, cells were grown on media containing glycans as the sole carbon source (n=3 separate cultures per substrate), and susC transcripts derived from PULs that encode GH76 and/or, GH92 enzymes were quantified by qPCR. y-axis: fold-change relative to glucose grown cells. x-axis labels: genes probed. Inset: levels of susC transcripts derived from PUL-Man1/2/3 when Bt was cultured on mannan comprising only the α1,6-Man backbone or Candida albicans mannan. Data are averages and standard deviations of three biological replicates. d, strains of 29 different bacterial species of Bacteroidetes were inoculated into minimal media containing S. cerevisiae mannan as sole carbon source (n=2 replicate cultures per strain). Growth measured at 48 h at A600nm. Inset: phylogeny of Bacteroidetes species; organisms growing on mannan connected by red lines.
Fig. 2
Fig. 2. Mannan PULs enable colonization of gnotobiotic mice; key biochemical and cellular features of the encoded enzymes.
a, colonization of gnotobiotic mice (n=5) by wild type Bt (red) and a mutant (black) lacking PUL-Man1/2/3. On day 0 mice were gavaged with ~108 CFUs of 50:50 of the two Bt strains and then fed a control diet lacking Bt-digestible glycans (green). Left: after 7 days the control diet was supplemented with 1% YM in drinking water (pink shading). Middle: identical treatment to the left Panel except no mannan was included after day 7 (shaded green). At day 21 mannan in the water was switched between the groups in the left and middle panels, indicated by the color panels (pink=mannan, green=no mannan). Right: mice fed the control diet (shaded green) were switched to a diet containing leavened bread (blue). The average abundance of the mannan utilization mutant (black) in mice fed the bread diet compared to the corresponding time points in mice fed the glycan-free diet (mean±s.e.m., 81%±1.2 in animals fed the bread diet versus 90%±1.7 in mice fed the glycan-free diet; P = 0.00005 by unpaired student’s t test). Time points at which there was a significant difference between the mutant and wild type Bt on the bread diet compared to the glycan-free diet (P ≤ 0.05) are indicated with an asterisk . b, fluorescent and light microscopic images of Bt incubated with polyclonal antibodies against BT3792 and BT3774. c, western blots of Bt cells cultured on YM that were untreated with proteinase K (0 h) or incubated with 2 mg/ml proteinase K for 16 h. RP; recombinant protein. Blots were probed with antibodies against the Bt enzymes. Localisation blots and microscopy images (b,c) are representative data from three biological replicates. d, e, phosphorylated high mannose N-glycan MNN4 and RNAaseB incubated with BT2629 (GH92 α-mannosidase), BT3783 (phosphatase) or BT3774 (GH38 α-mannosidase) and the products analyzed by capillary electrophoresis. M5 to M9 lack phosphate and mannose-1-phosphate groups. f, catalytic efficiency of the endo-α1,6-mannanases against α-1,6-mannooligosaccharides (SITable 4 full data).
Fig. 3
Fig. 3. Model of YM deconstruction by Bt.
Boxes show examples of bonds cleaved by the endo-α1,2-mannosidase BT3862, by the α-1,3- and α-1,2-mannosidase activities displayed by BT2629 and BT3784, and the Man-1-P and α-1,2-Man linkages targeted by BT3774. Structures of the enzymes that play a key role in mannan degradation, colour-ramped from the N (blue) to the C (red) terminus; ED Fig. 3 provides. In this model limited degradation occurs at the surface and the bulk of glycan degradation occurs in the periplasm. SusC-like proteins mediate transport across the outer membrane.
Fig. 4
Fig. 4. Bacteroides co-culture sharing experiments.
Bt was co-cultured with a, b, Bacteroides cellulosilyticus WH2 or with c, d, Bacteroides xylanisolvens NLAE-zI-p352 with either mannan (a and c) or mannose (b and d) as sole carbon source. Each non-mannan user was also cultured on mannan independently. The upper graph in each panel depicts the cfu ml-1 of each strain, relative to the cfu ml-1 at inoculation. Total cfu ml-1 were determined by colony counts, and the proportion of each bacteria was determined by qPCR of marker genes from genomic DNA (shown in the lower graph of each panel). Error bars represent s.d. of three biological replicates.
Fig. 5
Fig. 5. Model of HMNG depolymerisation by Bt.
The interaction of mannose with the surface glycan binding protein (SGBP) is shown, while the binding of the SusD homolog (D) to the reducing end GlcNAc directs the N-glycan into the SusC-like (C) porin. In both the yeast mannan and the HMNG models the bulk of glycan degradation occurs in the periplasm (P) and not on the surface. The likely enzymes involved in the periplasmic degradation of the trisaccharide generated by the HMNG-PUL encoded system is addressed in Supplementary Information Section 4.3.

References

    1. Arumugam M, et al. Enterotypes of the human gut microbiome. Nature. 2011;473:174–180. - PMC - PubMed
    1. Backhed F, Ley RE, Sonnenburg JL, Peterson DA, Gordon JI. Host-bacterial mutualism in the human intestine. Science. 2005;307:1915–1920. - PubMed
    1. Arpaia N, et al. Metabolites produced by commensal bacteria promote peripheral regulatory T-cell generation. Nature. 2013;504:451–455. - PMC - PubMed
    1. Flint HJ, Bayer EA, Rincon MT, Lamed R, White BA. Polysaccharide utilization by gut bacteria: potential for new insights from genomic analysis. Nat Rev Microbiol. 2008;6:121–131. - PubMed
    1. Kau AL, Ahern PP, Griffin NW, Goodman AL, Gordon JI. Human nutrition, the gut microbiome and the immune system. Nature. 2011;474:327–336. - PMC - PubMed

Publication types

MeSH terms