. 2014 Dec;6(12):1094-108.
doi: 10.18632/aging.100708.

Aged iPSCs display an uncommon mitochondrial appearance and fail to undergo in vitro neurogenesis

Aged iPSCs display an uncommon mitochondrial appearance and fail to undergo in vitro neurogenesis

Andrea Masotti et al. Aging (Albany NY). 2014 Dec.

Abstract

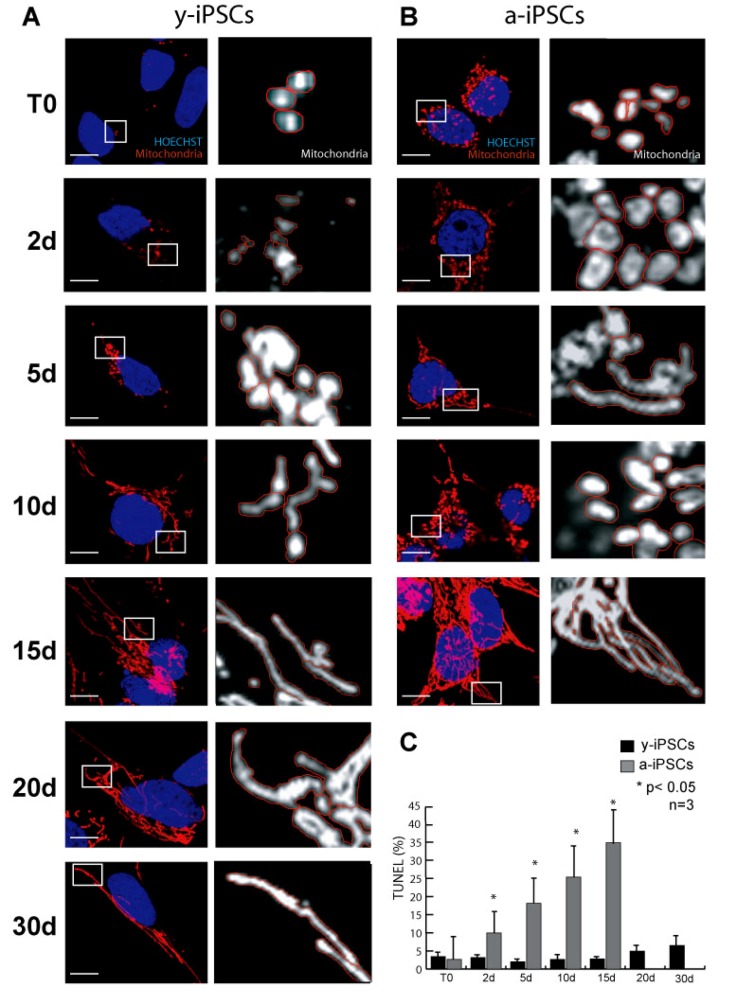
Reprogramming of human fibroblasts into induced pluripotent stem cells (iPSCs) leads to mitochondrial rejuvenation, making iPSCs a candidate model to study the mitochondrial biology during stemness and differentiation. At present, it is generally accepted that iPSCs can be maintained and propagated indefinitely in culture, but no specific studies have addressed this issue. In our study, we investigated features related to the 'biological age' of iPSCs, culturing and analyzing iPSCs kept for prolonged periods in vitro. We have demonstrated that aged iPSCs present an increased number of mitochondria per cell with an altered mitochondrial membrane potential and fail to properly undergo in vitro neurogenesis. In aged iPSCs we have also found an altered expression of genes relevant to mitochondria biogenesis. Overall, our results shed light on the mitochondrial biology of young and aged iPSCs and explore how an altered mitochondrial status may influence neuronal differentiation. Our work suggests to deepen the understanding of the iPSCs biology before considering their use in clinical applications.


Conflict of interest statement

Conflict of interest statement

The authors declare no financial, personal or professional competing interests.

Figures

Figure 1
Figure 1. Characterization of mitochondria in y- and a-iPSCs in proliferating condition and during in vitro neurogenesis
(A, B) Immunofluorescence analysis of mitochondria (red) in y-iPSCs (A) and in a-iPSCs (B) with nuclei counterstained with Hoechst (blue). On the right side of each photograph a higher magnification of the mitochondria is reported, mitochondria are colored in white and the perimeter is highlighted in red for better morphological visualization. Scale bar: 10 μm. (C) Quantification of the TUNEL assay in y- and a-iPSCs before and during neuronal differentiation. The bar graph represents quantitative data (expressed in % of TUNEL assay positive cells) of y-iPSCs and a-iPSCs. Data represent the mean ± SD of 3 experiments.
Figure 2
Figure 2. Analysis of neuronal differentiation and cell death in y- and a-iPSCs
Immunofluorescence analysis of y-iPSCs (A) and a-iPSCs (B) during neuronal differentiation stained with the neuronal marker β–III TUBULIN with nuclei counterstained with Hoechst. On the right of each photographs, the TUNEL assay corresponding to the same experiment is reported. The green cells represent TUNEL positive cells. Scale bar: 30 μm.
Figure 3
Figure 3. Quantitative analysis of the number of mitochondria in y- and a-iPSCs before and during neuronal differentiation
The bar graph represents the average number of mitochondria per cell and was obtained counting the mitochondria from immunofluorescence assays using the mitochondria specific antibody. The data were obtained from three independent experiments. Data are represented as mean ± SD.
Figure 4
Figure 4. Gene expression analysis of genes relevant to mitochondrial biogenesis and schematic drawing depicting the differences between young- and aged-iPSCs during neuronal differentiation in relation to mitochondrial number and cell death
(A-F) Normalized expression levels of UCP2 (A), TFAM (B), NRF1 (C), TFB1M (D), POLMRT (E) and POLG (F) genes. Red and blue lines indicate the expression behavior of y- and a-iPSCs, respectively, during differentiation. (G) The number of mitochondria, obtained by immunofluorescence, has been displayed for y- and a-iPSCs (red and blue lines, respectively). Dotted line indicates an arbitrary number of mitochondria. (H) Correlation between the number of mitochondria and gene expression levels has been calculated and reported in the table together with Pearson's correlation coefficients and statistical significance (p-value). (I) Scheme illustrating y- and a-iPSCs in relation to their number of mitochondria (on the y axis) before and during in vitro neurogenesis (with the time reported on the x axis). The black cell depicted, which represents a-iPSCs during neuronal differentiation, is full of mitochondria and encounters cell death.
Figure 5
Figure 5. Gene expression analysis of genes relevant to mitochondrial biogenesis in young and aged-iPSCs at day 0
Expression level of NRF1, POLG, UCP2, POLRMT, TFAM, TFB1M genes for two biological replicates (#1, #2) of y- and a-iPSCs. Data are represented as mean ± SD.
Figure 6
Figure 6. Gene expression analysis of genes relevant to mitochondrial biogenesis in young and aged-iPSCs during neuronal differentiation in relation to the mitochondrial number
Normalized expression levels of mitochondrial genes superimposed to the curve obtained after interpolation of mitochondrial number during differentiation of y-iPSCs (A) and a-iPSCs (B).
Figure 7
Figure 7. y- and a-iPSCs present differences in basal MMP and following H2O2 exposure
(A) JC-1 staining images before and after 5, 10 and 15 minutes after H2O2 exposure in y-iPSCs. (B) JC-1 staining images before and after 1 and 5 minutes after H2O2 exposure in a-iPSCs. Regions of high mitochondrial polarization are revealed by red fluorescence due to J-aggregate formation of the concentrated dye, whereas depolarized regions are indicated by green fluorescence of JC-1 monomers. Pictures are representative images chosen among 3 independent experiments performed in live imaging condition where CO2 (5%) and Temperature (37°C) were controlled using a top stage incubator. Magnified views of the boxed area are displayed as Insets in A and B. Scale bar: 75 μm. (C) Time course of y- and a-iPSCs before and during H2O2 treatment showing the fluorescence intensity ratio (expressed as %) for JC-1 staining (Red/Green fluorescence intensity ratio).

Similar articles

Cited by

References

    1. Takahashi K, Yamanaka S. Induction of pluripotent stem cells from mouse embryonic and adult fibroblast cultures by defined factors. Cell. 2006;126:663–676. - PubMed
    1. Wang A C. Manipulation of Human Induced Pluripotent Stem Cells. Current Protocols in Stem Cell Biology. 2012;23 - PubMed
    1. Thomson JA, Itskovitz-Eldor J, Shapiro SS, Waknitz MA, Swiergiel JJ, Marshall VS, Jones JM. Embryonic stem cell lines derived from human blastocysts. Science. 1998;282:1145–1147. - PubMed
    1. Lim WF, Inoue-Yokoo T, Tan KS, Lai MI, Sugiyama D. Hematopoietic cell differentiation from embryonic and induced pluripotent stem cells. Stem Cell Res Ther. 2013;4:71. - PMC - PubMed
    1. Liang G, Zhang Y. Genetic and epigenetic variations in iPSCs: potential causes and implications for application. Cell Stem Cell. 2013;13:149–159. - PMC - PubMed

Publication types