. 2015 Jan 8:5:7675.
doi: 10.1038/srep07675.

Small tRNA-derived RNAs are increased and more abundant than microRNAs in chronic hepatitis B and C

Affiliations

Small tRNA-derived RNAs are increased and more abundant than microRNAs in chronic hepatitis B and C

Sara R Selitsky et al. Sci Rep. .

Abstract

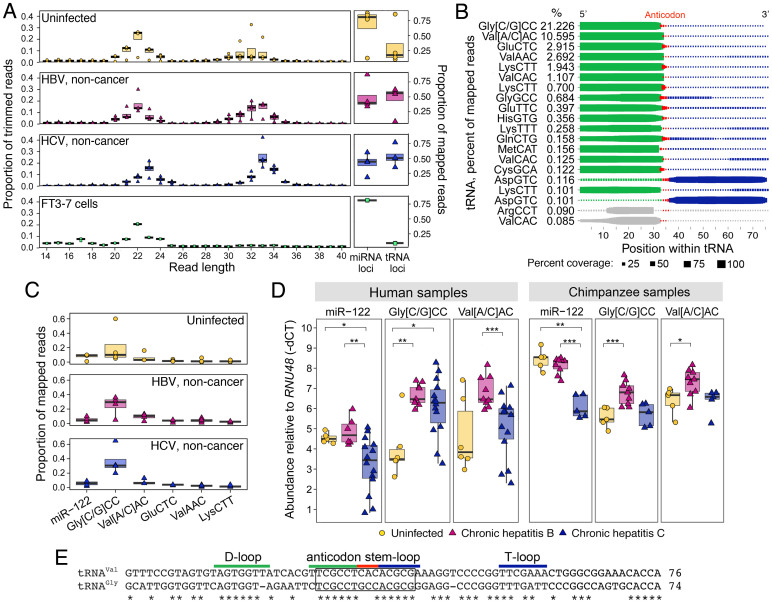
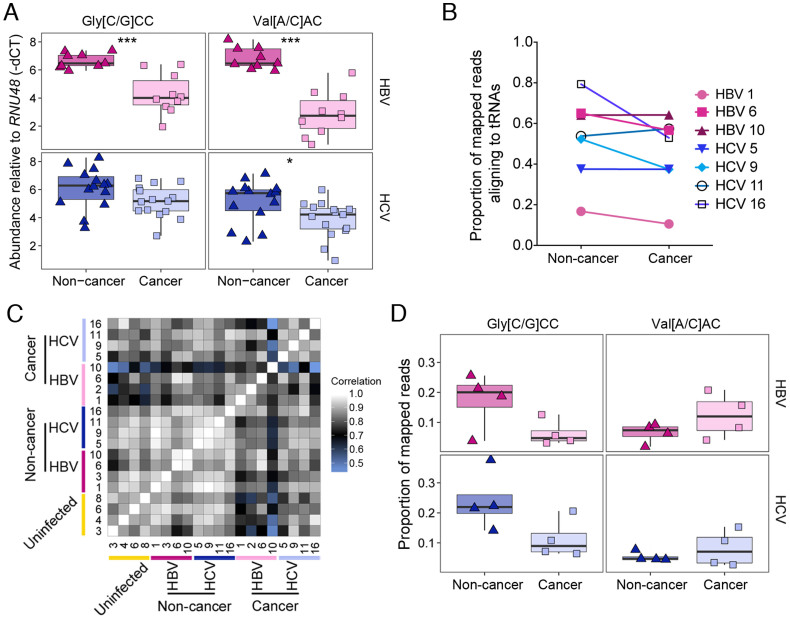
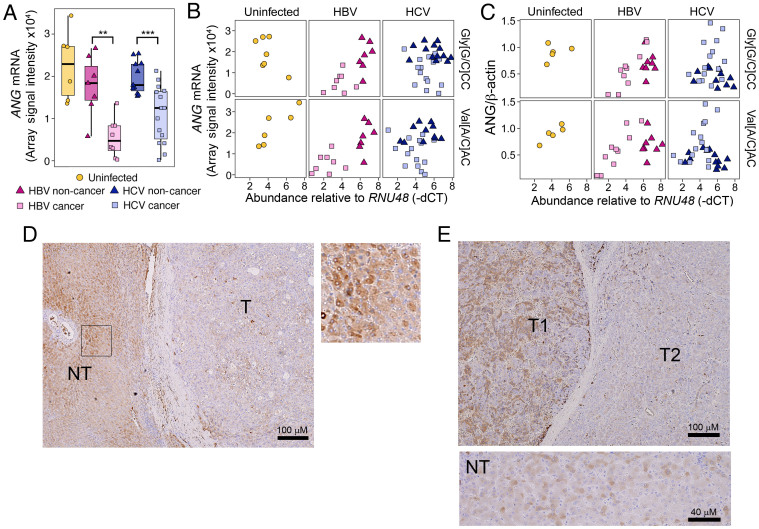
Persistent infections with hepatitis B virus (HBV) or hepatitis C virus (HCV) account for the majority of cases of hepatic cirrhosis and hepatocellular carcinoma (HCC) worldwide. Small, non-coding RNAs play important roles in virus-host interactions. We used high throughput sequencing to conduct an unbiased profiling of small (14-40 nts) RNAs in liver from Japanese subjects with advanced hepatitis B or C and hepatocellular carcinoma (HCC). Small RNAs derived from tRNAs, specifically 30-35 nucleotide-long 5' tRNA-halves (5' tRHs), were abundant in non-malignant liver and significantly increased in humans and chimpanzees with chronic viral hepatitis. 5' tRH abundance exceeded microRNA abundance in most infected non-cancerous tissues. In contrast, in matched cancer tissue, 5' tRH abundance was reduced, and relative abundance of individual 5' tRHs was altered. In hepatitis B-associated HCC, 5' tRH abundance correlated with expression of the tRNA-cleaving ribonuclease, angiogenin. These results demonstrate that tRHs are the most abundant small RNAs in chronically infected liver and that their abundance is altered in liver cancer.


Figures

Figure 1
Figure 1. tRH abundance in HBV- and HCV-infected liver.
(a) (left) Read length distribution of 14–40 nt RNAs in non-malignant liver from uninfected, HBV-, or HCV-infected subjects (n = 4 each), and FT3-7 cells (n = 3 replicates). (right) Proportion of reads mapping to miRNA versus tRNA loci. Boxes represent median ± 1.5 * interquartile range. (b) tRNA coverage plot from the average of the 20 non-cancer samples. Dot size represents percent of reads mapping at each base position within each tRNA (top 20 by average abundance). The anticodon is red, with 5′ bases green and 3′ bases blue. Gray: bases of RNAs that are non-tRHs. See Supplemental Figure 1. (c) Proportion of mapped reads aligning to miR-122 versus the five most abundant tRNA-derived RNAs. (d) (left) Expression levels (RT-qPCR) of miR-122, 5′ tRHGly (“Gly[C/G]CC”) and 5′ tRHVal (“Val[A/C]AC”) in uninfected (n = 5–6), HBV-infected (n = 6–9) and HCV-infected (n = 14) human liver. Numbers of samples differ due to limited RNA. (right) Similar results from uninfected (n = 5), HBV-infected (n = 9), and HCV-infected C (n = 5) chimpanzees. RNU48 was used as a normalizer. *P < 0.05; **P < 0.01; ***P < 0.005 by Mann-Whitney U-test. (e) ClustalW multiple sequence alignment of representative tRNAGly and tRNAVal genes from which 5′ tRHGly and 5′ tRHVal could originate (see Supplemental Figure 3). tRNAs regions are highlighted according to the color scheme in panel (b). The box identifies a unique conserved sequence motif described in the text. “Mapped reads” represents all reads aligning to miRNAs or tRNAs (see Methods).
Figure 2
Figure 2. 5′ tRH abundance in HBV- and HCV-associated hepatocellular carcinoma.
(b) Abundance (RT-qPCR) of (left) 5′ tRHGly (Gly[C/G]CC) and (right) 5′ tRHVal (Val[A/C]AC) in (top) non-malignant (n = 9) and cancer tissue (n = 10) from HBV-infected subjects, and (bottom) non-malignant (n = 14), and cancer tissue (n = 15) from HCV-infected subjects. Box and whisker plots are overlaid with data from each sample; whiskers extend to 1.5 * interquartile range. P-values calculated using Mann-Whitney U-test. *P < 0.05; **P < 0.01; ***P < 0.005. (b) Proportion of mapped reads aligning to tRNAs for the paired cancer and non-cancer tissue from subjects with chronic hepatitis B (n = 3) and hepatitis C (n = 4) (c) Correlation heatmap of tRNA-derived RNA expression profiles determined by small RNA sequencing. The colors of the cells represent Spearman's rank correlation coefficients of the relative levels of the 10 most abundant tRNA-derived RNAs between all pairs of tissue samples sequenced (n = 20). (d) Proportion of mapped reads that align to 5′ tRHGly and 5′ tRHVal in non-malignant and cancer tissue from (top) HBV-infected and (bottom) HCV-infected subjects. “Mapped reads” represents all reads aligning to miRNAs or tRNAs (see Methods).
Figure 3
Figure 3. Angiogenin expression in viral hepatitis and hepatocellular carcinoma.
(a) Normalized ANG mRNA levels from previously generated liver microarray data from uninfected subjects (n = 6), non-malignant (n = 7) and liver cancer (n = 8) tissue from HBV-infected subjects, and non-malignant (n = 11) and cancer tissue (n = 15) from HCV-infected subjects. **P < 0.01; ***P < 0.005, calculated by Mann-Whitney U-test. (b) Scatter plot of the levels of 5′ tRHs (RT-qPCR, -dCT normalized to RNU48) and ANG mRNA (microarray). 5′ tRHGly (“Gly[C/G]CC”): uninfected subjects (n = 7), non-cancer (n = 7) and cancer (n = 8) liver tissue from chronic hepatitis B subjects, and non-cancer (n = 11) and cancer (n = 15) liver tissue from chronic hepatitis C subjects; 5′ tRHVal: uninfected subjects (n = 6), non-cancer (n = 7) and cancer (n = 8) liver tissue from chronic hepatitis B subjects, and non-cancer (n = 11) and cancer (n = 15) liver tissue of chronic hepatitis C subjects. (c) Scatter plot of the levels of 5′ tRHs (RT-qPCR, -dCT normalized to RNU48) and ANG protein expression (normalized to β-actin) determined by immunoblot analysis. (d) Immunohistochemistry staining for ANG in formalin-fixed non-tumor (NT) and tumor tissue (T) from HBV-infected subject #10. (Right) Magnified view of non-tumor (NT). (e) ANG staining in adjacent tumor nodules (T1 and T2) and in non-tumor (NT) tissue from HCV-infected subject #7.

References

    1. Arzumanyan A., Reis H. M. & Feitelson M. A. Pathogenic mechanisms in HBV- and HCV-associated hepatocellular carcinoma. Nat Rev Cancer 13, 123–135 (2013). - PubMed
    1. Perz J. F., Armstrong G. L., Farrington L. A., Hutin Y. J. & Bell B. P. The contributions of hepatitis B virus and hepatitis C virus infections to cirrhosis and primary liver cancer worldwide. J Hepatol 45, 529–538 (2006). - PubMed
    1. Hou W. & Bonkovsky H. L. Non-coding RNAs in hepatitis C-induced hepatocellular carcinoma: dysregulation and implications for early detection, diagnosis and therapy. World J Gastroenterol 19, 7836–7845 (2013). - PMC - PubMed
    1. Xu X. et al. Hepatitis B virus X protein represses miRNA-148a to enhance tumorigenesis. J Clin Invest 123, 630–645 (2013). - PMC - PubMed
    1. Chen Y. et al. HCV-induced miR-21 contributes to evasion of host immune system by targeting MyD88 and IRAK1. PLoS Pathog 9, e1003248 (2013). - PMC - PubMed

Publication types

MeSH terms